







Countries Leading in AI: Global Ranking 2026
Leadership in artificial intelligence has become a strategic economic and technological advantage. Countries with strong AI ecosystems decide where capital, compute, and engineering talent end up. Everyone else imports their AI technologies from the countries that got there first.
Explore the Global AI Map
The rankings below tell you which countries lead and why. The LITSLINK AI Map shows what that leadership looks like on the ground: real companies and real products across the top 55 countries developing AI products.
For every country on the map, you’ll find the standout companies, their flagship products, each product’s main function, and a key insight about the national market. Geographic patterns jump out fast. Frontier labs cluster in a handful of cities. Voice AI concentrates in India, industrial AI runs through Germany, Japan, and Korea, and security AI clusters in Israel. Use the map to identify centers of activity in your industry, compare countries side by side, and pull valuable insights for future expansion or vendor selection.
The map complements the rankings; it doesn’t replace them. Indexes measure national capability. The map shows the commercial layer built on top, and how other countries compare on it. That’s what founders and industry leaders seeking partners, hiring pools, or market-entry evidence actually need for data-driven decisions.
Where is AI actually being built? Pick any of the 50 countries on the map and see the companies, products, and capabilities shaping its market.
Global AI Leading Countries: 2026 Snapshot
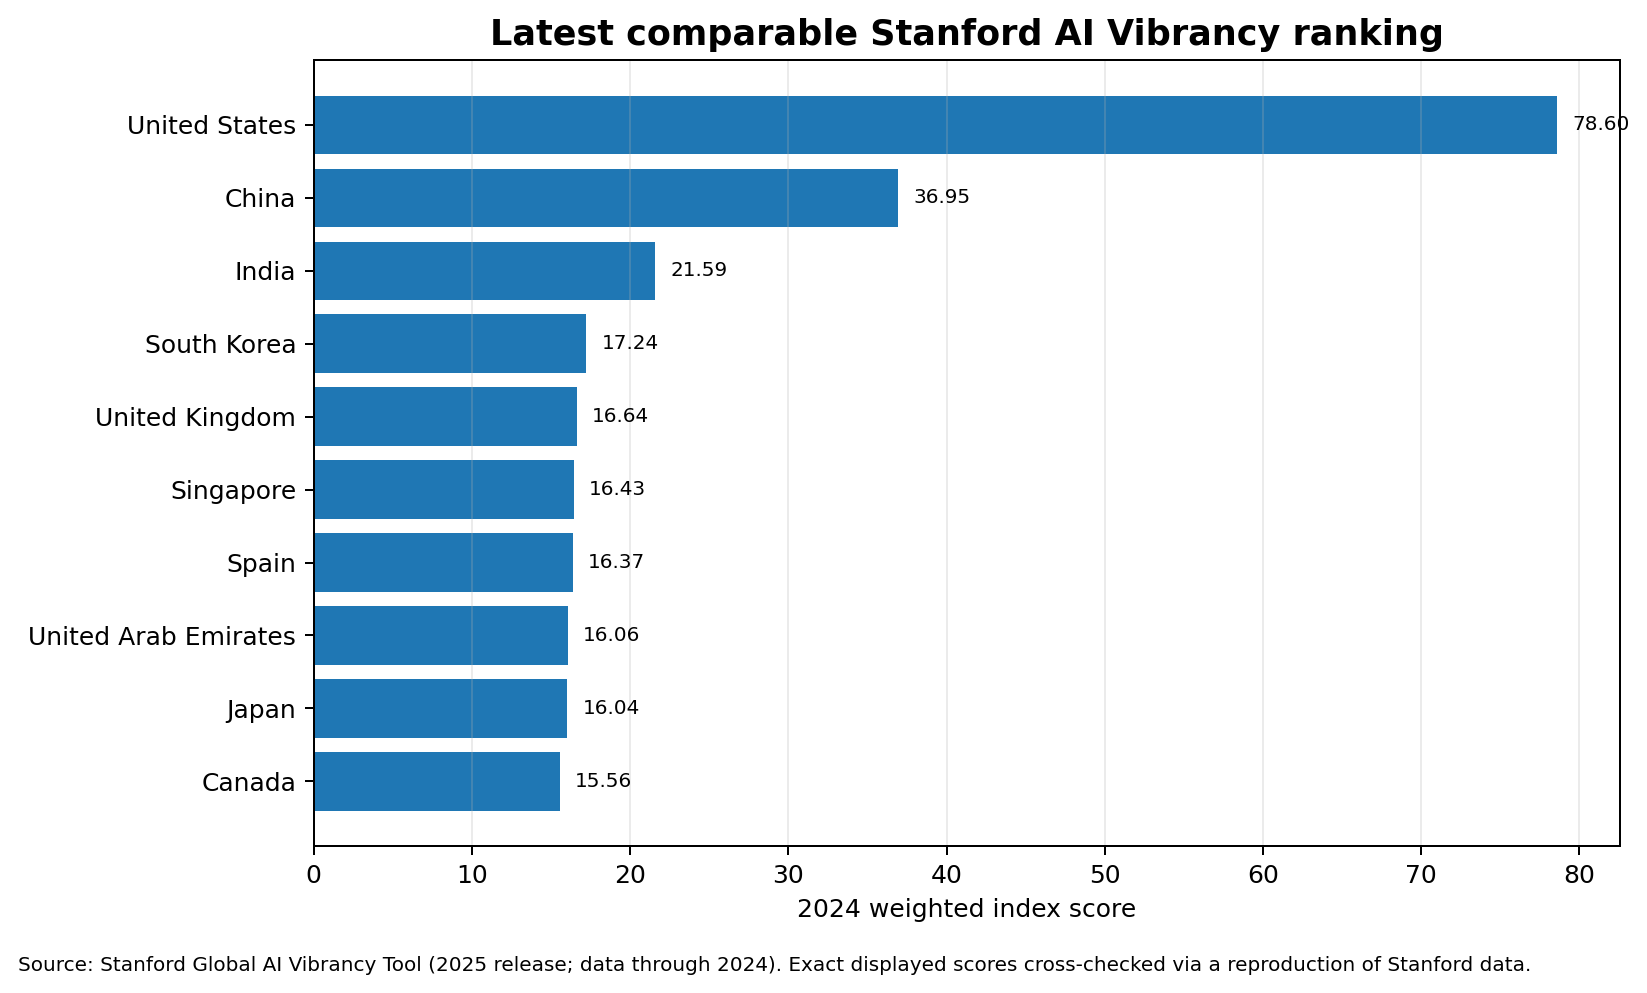
First, the answer before the analysis. The top AI ecosystems for 2026 are the United States, China, India, South Korea, the United Kingdom, Singapore, Spain, the United Arab Emirates, Japan, and Canada. The order is based on Stanford’s Global AI Vibrancy Tool, which is still the most soundly defensible composite comparison that anyone has made this year.
Why do rankings differ across data sources? Because every index assigns different relative importance to each capability. A patent-heavy methodology favors Korea and China. Weight adoption instead and the UAE and Singapore shoot up. A governance index puts Norway first, of all places. When two lists disagree, check what each one measures before deciding which is wrong. Usually neither is.
AI Superpowers, Established Leaders, and Emerging Challengers
Three tiers matter for anyone reading these rankings. The two global AI superpowers, the US and China, operate at a scale in capital and research volume that no other nation touches. Established leaders like India, the UK, Japan, and Canada each dominate a specific dimension or two. Then come the fast movers. Other countries are climbing quickly: Spain and the UAE on adoption, while emerging economies such as Saudi Arabia, Brazil, and Indonesia post the fastest talent growth anywhere.
None of this is an abstract scoreboard. The potential of AI at the national level is a determinant of economic competitiveness, productivity, technological sovereignty, security, and where the next generation of high value jobs will go. In fact, a large number of countries, more than half of the world, now have national AI strategies, and for good reason.
Top 10 AI Countries in 2026
| Rank | Country | Final Score* | Main AI Strength | Key Indicator (2025) | Notable Companies / Models |
|---|---|---|---|---|---|
| 1 | United States | 88 | Frontier models, productivity suites, developer tools | 88 AI products (33% of the map); $285.88B private investment, 1,953 newly funded companies | OpenAI (ChatGPT), Anthropic (Claude), Google (Gemini), Microsoft (Copilot), Meta (Llama), xAI (Grok) |
| 2 | China | 17 | Consumer assistants, video and open-weight models | 17 AI products (6%); 35 notable models | ByteDance (Doubao, CapCut AI), Baidu (ERNIE Bot), Tencent (Yuanbao), Moonshot (Kimi), DeepSeek |
| 3 | United Kingdom | 13 | Voice cloning, corporate video, B2B data | 13 AI products (5%); $5.90B private investment, 172 newly funded companies | ElevenLabs, Synthesia, Veed.io, Stable Diffusion, PolyAI |
| 4 | Ukraine | 13 | Photo and video apps, voice, defence, state AI | 13 AI products (5%); 3 AI unicorns founded by Ukrainians, $15.1B combined valuation | Reface, Skylum (Luminar Neo), YouScan, Respeecher, Diia.AI |
| 5 | India | 11 | Content generation, chatbots, medical imaging | 11 AI products (4%); $4.09B private investment | Sarvam, Fliki, Tars, Haptik, Qure.ai |
| 6 | South Korea | 11 | Domestic LLMs, research copilots, medical imaging | 11 AI products (4%); world leader in AI patents per capita | Naver (HyperCLOVA X), LG (EXAONE), Upstage (Solar), Kakao (Kanana), Lunit |
| 7 | Poland | 7 | Marketing, customer service and retail AI | 7 AI products (3%); 28.50% population diffusion | Surfer SEO, Tidio, Brand24, Synerise |
| 8 | Canada | 6 | Image generation, enterprise models, robotics | 6 AI products (2%); $4.28B private investment | Ideogram, Cohere (Command), Waabi, Coveo |
| 9 | France | 6 | Open models, creative tools, healthcare | 6 AI products (2%); 44.00% population diffusion | Mistral (Le Chat), Hugging Face, PhotoRoom, Nabla |
| 10 | Japan | 5 | Precision, automation, hardware-integration | 5 AI products (2%); $1.11B private investment | SoftBank (Pepper), Preferred Networks (PLaMo, PyTorch/Chainer), ELYZA, ABEJA |
*Final Score = number of AI products on the LITSLINK AI Map.
Positions shift with methodology, sometimes by five or six places. A country can rank tenth overall while topping an entire category, so the sections below unpack the factors behind the rankings instead of treating one table as the whole story.
What Makes a Country a Global AI Leader?
No single number tells you who is leading in AI. Research says one thing, investment another, AI adoption a third. Frontier models, infrastructure, AI talent, governance — they all crown different winners. Seven measurable factors decide the rankings above, drawn from the 2026 Stanford AI Index plus current government data, and each has a different leader. The sections below take them one at a time.
AI Research and Innovation
China leads the raw volume of AI research: publications, citations, patent grants. In 2024, Chinese institutions produced 41 of the 100 most-cited AI papers, up from 33 three years earlier. The US answer is quality and frontier output. American labs shipped 59 notable models in 2025 against 35 from Chinese labs, and US intellectual property skews toward higher-impact patents. Korea, meanwhile, quietly leads patents per capita. So which country “leads research” depends on what gets counted, volume or influence or model innovation, and honest analysts say so upfront. On university depth, China has 107 universities offering AI subjects versus 26 top universities for AI subjects in the United States. By contrast, quality can be more concentrated: Singapore posts the highest average subject score at 90.50 out of 100, while South Korea places 8 universities among top AI programs.
AI Talent
Cross-country claims about total AI researchers or graduates rarely survive contact with a methodology section. Stanford sidesteps the problem with LinkedIn-based talent concentration, which can make talent look especially strong when it is concentrated in small, high-performing ecosystems. Israel leads there at 2.10% of members working in AI. Singapore follows at 1.82%, Germany at 1.15%, Korea at 1.05%. The growth story reads differently: the UAE grew its concentration 121% between 2019 and 2025, India 120%, and India also scores 9.12 out of 16.67 in the Talent Index. And one warning sign for the US, where researcher and developer inflow fell 89% from its 2017 level. Top universities and higher education still anchor the pipelines. AI talent, though, now moves to wherever compute and funding live.
AI Investment
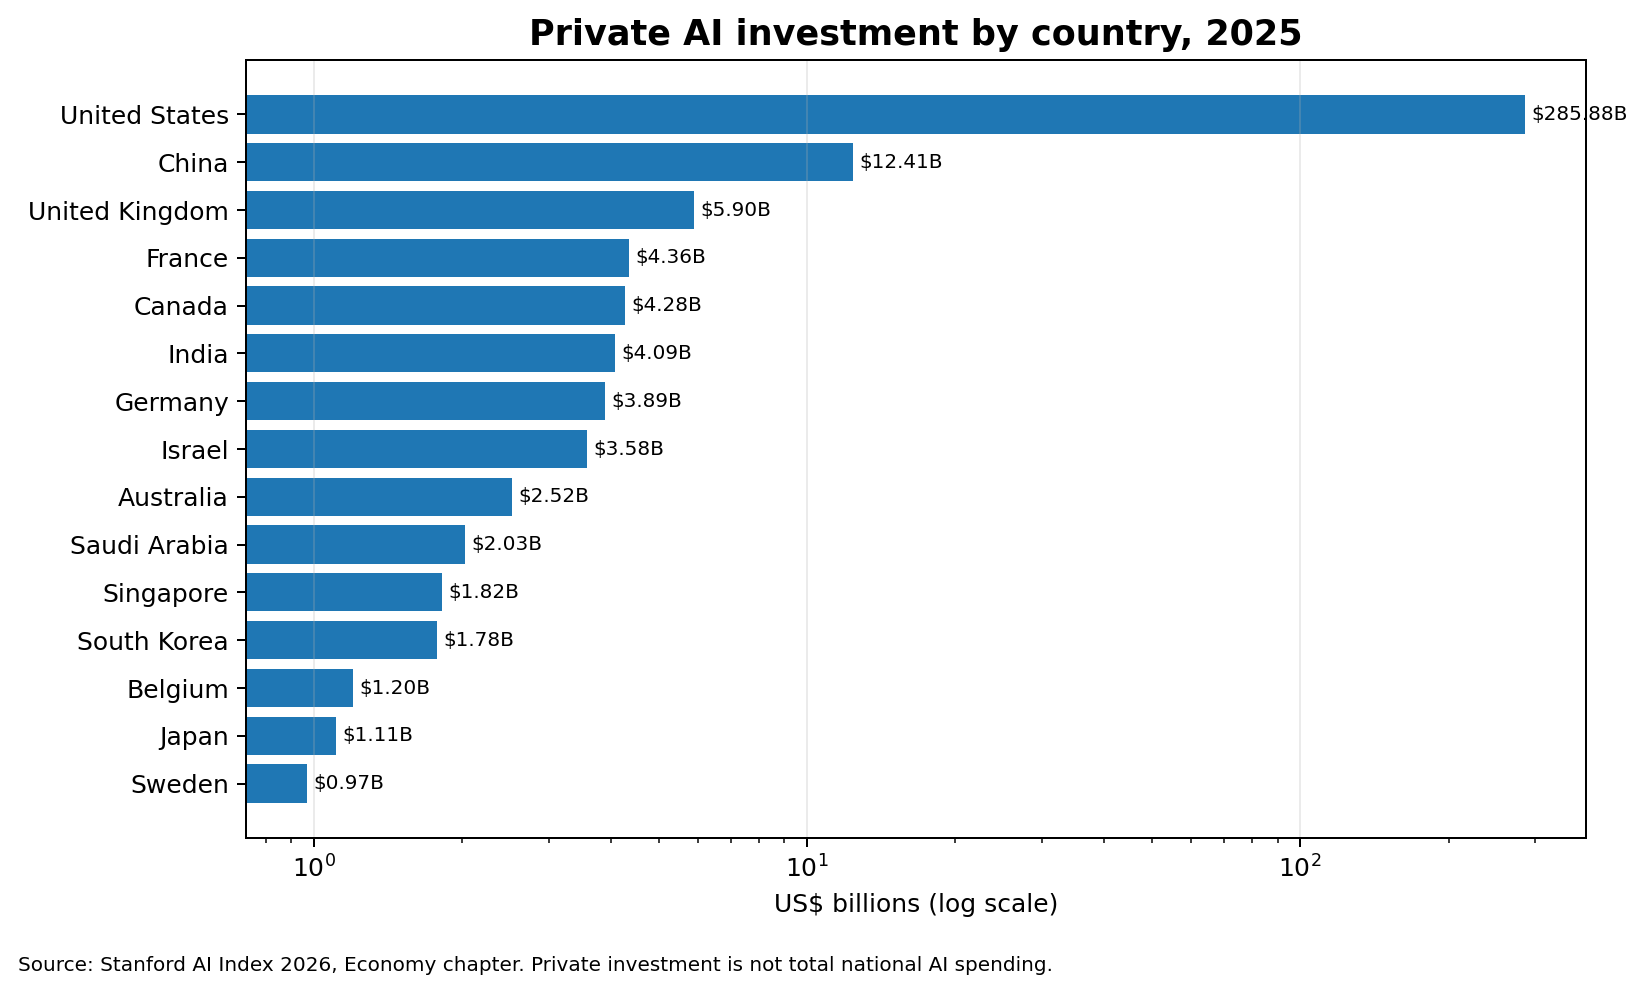
US private AI investment hit $285.88B in 2025. China recorded $12.41B on the same private measure, roughly 23x less. Before quoting that gap in a board deck, read Stanford’s explicit warning that private totals understate the Chinese figure, since state guidance funds and government investment channels aren’t fully captured. The next tier: UK $5.90B, France $4.36B, Canada $4.28B, India $4.09B, Germany $3.89B, Israel $3.58B.
Compute and AI Infrastructure
Global AI compute reached an estimated 17.1 million Nvidia H100-equivalent units, and the total has grown about 3.3x per year since 2022. The US hosts 5,427 data centers. More than ten times any other country in Stanford’s 2026 summary. Public compute infrastructure is the emerging counterweight: India’s shared program passed 45,000 GPUs by June 2026, and the UK is putting £2B into a 20x public compute expansion by 2030. Training frontier models without this layer isn’t possible. Full stop.
AI Companies and Startups
The most reliable counting of all AI startups is newly funded AI companies per year, as it is the cleanest of the flow metrics. The 2025 totals: US 1,953, UK 172, China 161, India 108, Germany 92, France 84, Canada 79, Israel 64. Frontier Labs focuses even more than that, and most of the top model developers are in the USA, China, and some of the European hubs.
Enterprise and Consumer AI Adoption
Generative AI reached 53% of the measured global population within three years of launch. Fastest technology diffusion on record. Country-level AI adoption tells a different story than capability rankings, though: the UAE leads population diffusion at 64.0% in late 2025, then Singapore at 60.9%, Norway at 46.4%, France at 44.0%. The US? 24th, at 28.3%. On the enterprise side, 88% of organizations worldwide said they are using AI in 2025, which isn’t attributable to any specific country.
Government Strategy and Responsible AI
Governance is the area that turns upside-down in terms of capability rankings. Norway has come out on top at the 2026 Global Index on Responsible AI, followed by Italy, Ireland, and France. China is 43.58 (#42) on that governance-implementation measure; the US is 53.34 (#27). Only approximately 54% of jurisdictions, in total, have a national AI policy or similar, and only 18% mandate disclosure of government AI systems. There’s another question that involves readiness by the government. Oxford Insight 2025 ranks the US #1 on the government’s ability to harness the possibilities of AI for public service delivery and the extent of AI use in public service systems for social good. In the Policy and Governance Index, Singapore scores 0.56, Germany 0.52, and the UK 2.53. The UAE appointed the world’s first Minister of AI in 2017, an early signal of state-level prioritization. But regulatory maturity is not regulatory rigor or vice versa it happens all the time.
Top 10 Countries in AI Development: Comprehensive Rankings
The rankings below are based on a combination of research, AI talent, investment, infrastructure, model development, AI adoption and governance. The order follows Stanford's Global AI Vibrancy Tool (2025 release, data through 2024). The 2025 figures on investment, models, adoption and talent below come from the Stanford AI Index 2026.
United States: AI Research, Startups, and Superpower Scale
The US ranks first because its strengths feed each other. It also has 26 top universities for AI subjects, which strengthens its academic base and overall position. Frontier labs (59 notable models in 2025), unmatched capital ($285.88B private investment), the deepest startup pipeline (1,953 newly funded companies), and 5,427 data centers. Each piece funds the next, and America’s AI Action Plan added 90+ federal actions across innovation, infrastructure, and security on top. Worth remembering that the United States leads the overall AI race without topping every metric. Patent volume belongs to its rival, and on consumer AI adoption the US sits in the lower half, 24th of 30 economies.
China: Large-Scale AI Development and Deployment
The score of 36.95 is what China gets from sheer size. It tops both the number of published papers and citations and has 41 of the 100 most-cited papers on AI published in 2024. China also has 107 universities offering AI subjects, more than four times the US total, which helps explain the scale behind that research progress. Its 35 notable models in 2025 trail the US count, sure, yet by March 2026 Stanford measured only a 2.7% performance gap between the top US and Chinese frontier models, bringing the race much closer than many assume. The State Council’s 2025 “AI+” opinion sets deployment targets for 2027 and 2030. On responsible AI and transparency, the country ranks lower, GIRAI #42. A real governance gap, worth naming without overstating.
India: AI Talent, Adoption, and Public Compute Scale
India jumped from #7 to #3 in Stanford’s latest comparison, though some composite rankings place it at #6 with a score of 32, showing how methodology can shift its global position, and the case rests on far more than population. India scores 9.12 out of 16.67 in the Talent Index, reinforcing that its rise is talent-driven. The increases in talent concentration were at the second-fastest pace in the country since 2019. In 2025, there were 108 new companies funded by private investment totaling $4.09B. The IndiaAI Mission, with an outlay of more than ₹10,372 crore, has established shared compute with more than 45,000 GPUs and supports home-grown foundation models from Sarvam AI, BharatGen, Gnani, and Soket.
South Korea: Patents, Semiconductors, and Industrial AI
This is the nation with the most patents per capita in the field of AI, and it complements this with the production and use of semiconductors and in industry by LG, Naver, and Samsung’s supply chain. South Korea also has 8 top AI universities, which helps explain the technical depth behind that progress. Population diffusion hit 30.7% in late 2025, the largest half-year gain Stanford recorded. And the Framework Act on the Development of Artificial Intelligence took effect on January 22, 2026, making it one of the first comprehensive national AI laws in force anywhere. Its broader infrastructure readiness score is 4.23 out of 16.67, so industrial strength does not automatically mean top-tier national infrastructure readiness, and some comparative rankings place it at #4 with a score of 35.
United Kingdom: Research and AI Ecosystem
The UK ranks fifth on frontier research plus startup flow, and in an alternate comparison it ranks #5 with a score of 33, reinforcing its place in Europe. Google DeepMind anchors the research base. Some 172 newly funded companies in 2025 put the UK second only to the US on that measure, ahead of the Chinese count, and private investment reached $5.90B. On policy, the government reports 38 of 50 AI Opportunities Action Plan actions met after one year, five AI Growth Zones designated, £2B committed to compute. The UK also scores 2.53 in the Policy and Governance Index.
Singapore: Adoption and Government Readiness
Singapore proves a small country can outscore giants through density and coordination. Population diffusion of 60.9% is second worldwide. Singapore also leads in government AI readiness and digital infrastructure, which helps explain why it outperforms larger countries. Talent concentration is 1.82%, second only to Israel. The refreshed national strategy added a National AI Council in February 2026, and more than 70 companies now run AI Centers of Excellence there, with some rankings placing it #3 with a score of 37. Private investment of $1.82B looks modest next to the giants. Per capita, it’s enormous. That concentrated performance also shows up in quality: Singapore achieves the highest average subject score at 90.50 out of 100, which highlights its edge beyond scale.
Spain: Fast Adoption and a Public AI Stack
Spain is the entry most “usual suspects” lists miss. Population diffusion reached 41.8% (sixth worldwide), talent concentration grew 77% since 2019, and the national strategy adds €1.5B in public investment along with industrial access to the MareNostrum 5 supercomputer and ALIA, a public family of multilingual models.
United Arab Emirates: Adoption and Sovereign Investment
The United Arab Emirates leads the entire world in population diffusion at 64.0%. It also posted the fastest talent concentration growth anywhere, +121% since 2019. The UAE appointed the world’s first Minister of AI in 2017, showing how early it moved on national AI policy and social priorities. G42, the Technology Innovation Institute’s Falcon models, and Core42 give the market commercial depth while sovereign infrastructure buildout accelerates, and the UAE Charter for the Development and Use of AI frames responsible use. The UAE’s edge, in a word: speed.
Japan: Industrial AI and a New National Plan
Japan’s story is industrial rather than venture-driven. Yes, $1.11B in private investment and 56 newly funded companies in 2025 look light. The depth sits in enterprise R&D: Sakana AI, Preferred Networks, NTT’s tsuzumi. The Second AI Basic Plan, issued July 2026, includes AI deployment to 180,000 government employees, which is a rare, concrete public service adoption number in a field full of vague pledges.
Canada: Research Institutions and Talent
Canada punches far above its startup volume through research depth. Mila, the Vector Institute, and Amii built much of the machine-learning field’s foundations, and Cohere and Waabi show the commercialization layer works. Private investment reached $4.28B in 2025, with population diffusion at 35.0%. The 2026 AI for All strategy plans to grow CIFAR AI Chairs from about 130 to nearly 200 researchers, a bet on the next generation of the field.
Established Leaders Outside the Top 10: France, Germany, and Israel
Three heavyweights sit just outside Stanford’s latest top 10. Each leads somewhere else. France (#13) recorded $4.36B in private investment, ranks fourth on responsible AI (GIRAI 70.3), hosts Mistral AI, and committed nearly €2.5B of France 2030 funding to its third-phase strategy. Germany (#15) pairs $3.89B in investment with industrial depth through Siemens, Bosch, and SAP, despite having just 1 top AI university in this comparison, and posted a 0.52 Policy and Governance Index score alongside a federal plan to at least double data-center capacity by 2030. Israel (#14) is the #1 country worldwide for talent concentration at 2.10% and drew $3.58B across 64 newly funded companies. That density of AI startups has no equal among larger economies.
Leading AI Companies and Products Across 55 Countries
Rankings measure capability. Markets measure something blunter: which products actually ship. National AI leadership shows up in the companies that bring AI technologies to market across every industry, so the table below maps the commercial layer behind the major AI ecosystems, frontier labs and applied products alike.
| # | Country | Notable Companies / Products (from the map) | Primary Function and Strength |
|---|---|---|---|
| 1 | United States | OpenAI (ChatGPT), Anthropic (Claude), Google (Gemini), Microsoft (Copilot), Meta (Llama), xAI (Grok) | Frontier models, productivity suites, enterprise platforms |
| 2 | China | DeepSeek, ByteDance (Doubao, CapCut), Baidu (ERNIE Bot), Tencent (Yuanbao), Moonshot (Kimi) | Consumer assistants at scale, open-weight models |
| 3 | United Kingdom | ElevenLabs, Synthesia, Veed.io, Cognism | Voice cloning, corporate video, B2B data |
| 4 | India | Fliki, Rytr, Tars, Pepper Content | Text-to-video, content generation, chatbot builders |
| 5 | South Korea | Liner, DeepBrain AI, VUNO | Research copilots, avatars, medical imaging |
| 6 | Ukraine | Reface, Skylum (Luminar Neo), YouScan, Diia.AI | Face swap, photo editing, the first national AI assistant |
| 7 | Germany | DeepL, ChatPDF | Professional translation, document analysis |
| 8 | Slovakia | Photoneo, Bloomreach (Exponea) | Industrial 3D vision, customer-experience personalization |
| 9 | Switzerland | Scandit, Metabolic | Mobile data capture, drug-discovery models |
| 10 | Poland | Surfer SEO, Tidio, Brand24 | Content optimization, e-commerce chat, brand monitoring |
| 11 | Australia | Canva (Magic Studio), Leonardo.Ai | Mass-market design, image generation |
| 12 | Canada | Ideogram | Text-accurate image and logo generation |
| 13 | Israel | Wix AI, Anyword | Site building, predictive marketing copy |
| 14 | Netherlands | LALAL.AI, Writefull | Audio stem separation, academic writing |
| 15 | France | PhotoRoom, Hugging Face | Product photo editing, open-model hub |
| 16 | Italy | Bending Spoons (Remini), Contents.ai | Photo restoration, content platforms |
| 17 | Turkey | Fal.ai, Robomotion | Generative-media infrastructure, process automation |
| 18 | Japan | SoftBank (Pepper), Preferred Networks | Robotics, deep-learning frameworks |
| 19 | Austria | TTTech Auto, Anyline | Autonomous-driving safety software, mobile OCR |
| 20 | Lithuania | Interactio, Vinted Assistant | Real-time event translation, e-commerce recommendations |
| 21 | Finland | Aiven, Ultrahack | Cloud optimization, applied challenges and hackathons |
| 22 | Bulgaria | Swoop AI, Hyperscience (Sofia R&D hub) | Trend forecasting, document processing |
| 23 | Thailand | Mandala AI, Meticuly | Social intelligence, patient-specific implants |
| 24 | Vietnam | FPT.AI, VinAI | Conversational suites, computer vision for vehicles |
| 25 | Romania | UiPath | Robotic process automation |
| 26 | Sweden | Epiroc (6th Sense) | Autonomous mining systems |
| 27 | Czechia | Rossum | Intelligent document capture |
| 28 | Ireland | Boxever (Salesforce) | Customer-experience personalization |
| 29 | Portugal | Unbabel | Machine translation for support teams |
| 30 | Spain | Sherpa AI | Conversational and predictive assistants |
| 31 | Norway | Huddlestock | Trading and wealth-management tools |
| 32 | Latvia | Nordigen (GoCardless) | Open-banking transaction analysis |
| 33 | Estonia | Starship Technologies | Autonomous delivery robots |
| 34 | Mexico | Vianovo | Customer-service chatbots |
| 35 | Singapore | Hypotenuse AI | E-commerce content generation |
| 36 | Denmark | Uizard | Sketch-to-wireframe design |
| 37 | Saudi Arabia | Ureed | Freelancer matching |
| 38 | United Arab Emirates | G42, TII (Falcon) | Open foundation models, sovereign compute |
| 39 | Hungary | AImotive | Self-driving software |
| 40 | Greece | Metis | Maritime operations prediction |
| 41 | New Zealand | Soul Machines | Autonomous digital avatars |
| 42 | Brazil | Trocafone | Price prediction for used electronics |
| 43 | South Africa | DataProphet | Predictive maintenance for manufacturing |
| 44 | Chile | Polymath Ventures | Construction supply-chain optimization |
| 45 | Colombia | Rappi (Turbo) | Delivery and logistics |
| 46 | Croatia | Photomath | Camera-based math tutoring |
| 47 | Belgium | Collibra | Data and AI governance |
| 48 | Luxembourg | AIVA | Music composition for film and games |
| 49 | Argentina | Mural | Collaborative whiteboard intelligence |
| 50 | Malaysia | MIMOS (ILMU) | Sovereign Malay-language model |
| 51 | Armenia | Krisp | Voice AI |
| 52 | Egypt | Synapse Analytics | B2B analytics |
| 53 | Indonesia | Kata.ai | Conversational agents and customer support |
| 54 | Qatar | Fanar | National large language model |
| 55 | Taiwan | Appier | AI marketing analytics |
The table mirrors the live map row by row. What it can’t show is depth: the US section alone runs to 88 products, and every country entry on the map adds each product’s main function plus a key insight about the market. It’s the same product landscape we track daily as a company building custom AI solutions for US and European clients.
Leading Countries in Artificial Intelligence by Category
Overall rankings hide as much as they reveal, because leadership splits by category. A country can top one dimension and miss the top ten entirely. The category rankings below stick to current, verifiable data over reputation.
Leading Countries in AI Research
China leads research volume: most publications, most citations, most patents, including 41 of 2024’s most-cited papers. The US leads frontier output (59 vs. 35 notable models) and higher-impact patents. Korea leads per-capita patent intensity. Academic strength is similarly split: China has 107 top universities for AI subjects versus 26 in the United States, while Singapore’s concentrated excellence gives it the highest average subject score at 90.50 out of 100. Three research crowns, three different heads.
Leading Countries for AI Talent
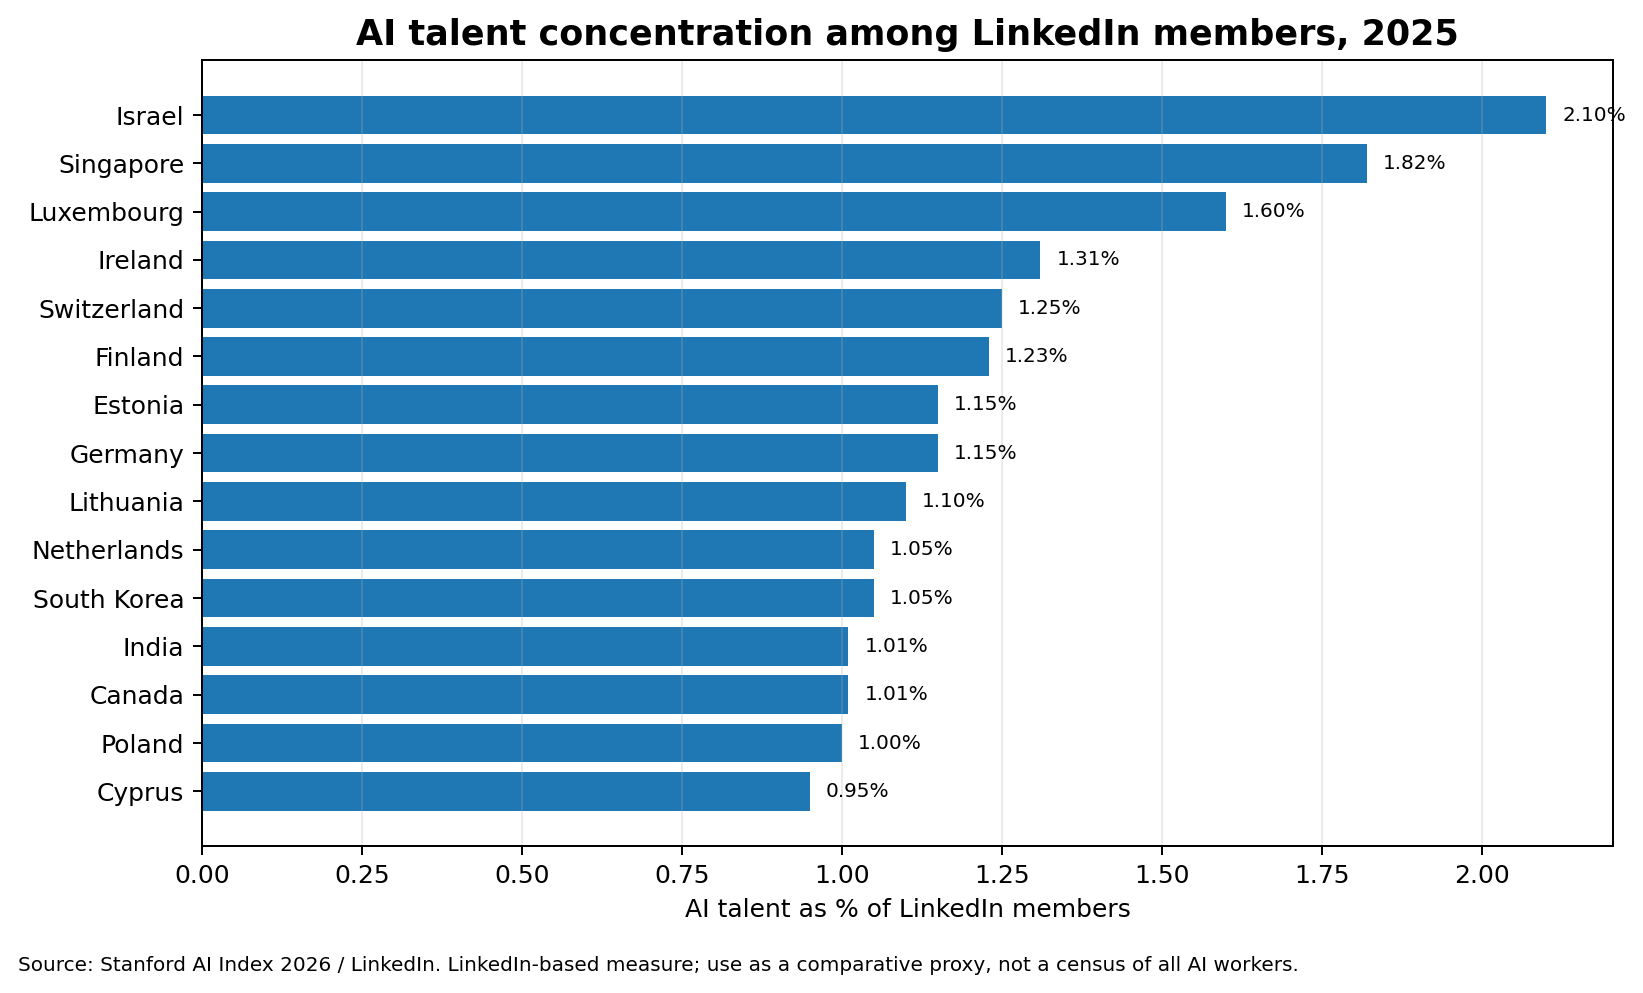
Israel (2.10%) and Singapore (1.82%) lead talent concentration among LinkedIn members, while the UAE (+121%) and India (+120%) own the growth story since 2019. Switzerland and Singapore also stand out for researcher density per capita. Talent development programs, immigration policy, and AI education capacity now matter as much as salaries do in these rankings. Maybe more.
Leading Countries in AI Investment and Startups
The US dominates both totals, with $285.88B in private investment and 1,953 newly funded AI startups in 2025. The UK leads the second tier on startup flow (172). France, Canada, India, Germany, and Israel form the next investment band. Relative to market size, Israel and Singapore outperform every large economy, and innovation hubs like Bangalore and Paris keep gaining ground.
Top Countries in AI Infrastructure
Infrastructure has three lenses, and mixing them produces nonsense scores. Physical scale: the US, 5,427 data centers. Public shared compute: India, 45,000+ GPUs under IndiaAI. Committed expansion: the UK’s 20x compute plan and Spain’s supercomputing access. Each lens supports a different kind of AI development, from frontier training all the way down to broad national access.
Leading Countries in AI Adoption
The adoption rankings for late 2025: UAE 64.0%, Singapore 60.9%, Norway 46.4%, Ireland 44.6%, France 44.0%. The US at 28.3% shows that production power and consumer diffusion are separate questions altogether. Enterprise AI adoption runs ahead of consumer figures in nearly every industry, with 88% of organizations globally reporting AI use.
Leading Countries in AI Governance
Norway (75.3), Italy (72.7), and Ireland (71.4) lead the responsible AI governance rankings in GIRAI 2026, with France, the Netherlands, Germany, and the UK close behind. The EU AI Act shapes AI regulation across the bloc. Korea’s Framework Act is now in force. The US, oddly, pairs a #1 government-readiness rank with a #27 responsible-AI score. Maturity of AI governance and strictness of AI regulation are different axes, and conflating them produces bad policy analysis.
The United States vs. China: Who Leads the Global AI Race?
The United States and China are the two dominant global AI superpowers in 2026, and the gap between them looks wide on paper: a final Stanford Vibrancy score of 78.60 against 36.95. But the headline number hides a split decision. The US leads on capital, frontier models, and startup formation; China answers with research output nobody matches: first in publications, citations, and patents. The dimensions below show where each one actually wins.
| Dimension | United States | China | What It Means |
|---|---|---|---|
| Final score (Stanford Vibrancy) | 78.60 (#1) | 36.95 (#2) | Latest comparable composite, 2024 data |
| Notable models, 2025 | 59 | 35 | US leads count, gap at the top is narrow |
| Top-model performance gap, Mar 2026 | Baseline | 2.7% behind | Frontier quality nearly converged |
| Private investment, 2025 | $285.88B | $12.41B | Private capital only, state funds not fully captured |
| Newly funded companies, 2025 | 1,953 | 161 | Startup formation heavily favors the US |
| Research output | Higher-impact patents, frontier models | Leads publications, citations, patent volume | Different dimensions, different winners |
| Data centers | 5,427 | No comparable current figure | Compute concentration favors the US |
| Responsible AI (GIRAI 2026) | 53.34 (#27) | 43.58 (#42) | Governance, not capability |
| Policy direction | AI Action Plan, 90+ federal actions | "AI+" targets for 2027/2030 | Active programs on both sides |
Research output. Does China dominate AI research? By volume, yes. China leads publications, citations, and patent filings. By impact, no: American companies and universities produce more notable models and higher-impact intellectual property, and strength in frontier large language models still sits with US labs. Both claims hold at once, which is exactly why global AI development patterns resist one-line summaries.
Investment and government investment. The 23x private-investment gap is real but incomplete. Beijing routes serious money through state guidance funds that private-market data never sees. Read $285.88B vs. $12.41B as a venture-capital comparison.
Talent development and AI education. The US still holds the largest AI workforce and the strongest top universities. Its researcher inflow, however, dropped 89% from 2017 levels. Chinese universities graduate enormous engineering cohorts, and the country’s education systems keep expanding AI education from primary school through doctoral programs. Talent development is the dimension most likely to decide the future of this race, and it’s the one moving fastest.
Governance and responsible AI development. Neither of the global AI superpowers leads here, which surprises people. Both trail a dozen mid-sized democracies on the responsible AI index, and public trust plus public engagement with AI policy remain weak spots for each. China leads on speed of state deployment, the US on institutional checks.
The verdict. The US leads the overall global AI race in 2026 on capital, frontier models, startups, and compute. China is the strongest challenger, leads research scale, and has nearly closed the model-quality gap. From here, the competition is about balance across the whole system.
Global AI Leadership: Key Trends for 2026
The model-quality gap is closing
A 2.7% frontier-model performance gap between the top American and Chinese models, down from double digits. Model quality is no longer the moat. Distribution, compute, and industry integration are.
Sovereignty is the new default AI strategy
Most of the top ten now fund domestic compute, domestic models, or both. An AI strategy without a sovereignty component increasingly reads as incomplete, and national strategies elsewhere are copying the playbook fast.
Compute concentrates faster than policy can spread it
17.1M H100-equivalents globally, growing 3.3x a year, with data centers overwhelmingly parked in one country. Shared public compute (IndiaAI, EU supercomputers, the UK expansion) is the counterweight, one that promises lower barriers to entry for smaller players. Innovation follows compute. So this fight matters.
AI adoption keeps decoupling from capability
The top model builders are not the top adopters of AI technologies. Expect the UAE, Singapore, and the Nordics to keep pulling ahead on diffusion, industry by industry, while the superpowers keep producing. Generative AI hitting 53% of the global population within three years suggests the future of adoption is short.
Talent moves rankings faster than infrastructure
Concentration growth of +121% (UAE) and +120% (India) inside six years shows how fast AI skills migrate toward opportunity. Countries investing in AI education pipelines and competing for the next generation of researchers are really competing for their 2030 ranking.
Responsible AI governance trails deployment
Only 54% of countries have adopted an AI policy at the national level. Only 55% of active frameworks show implementation evidence. Only 18% require disclosure of government AI systems. That gap between deployment speed and responsible AI governance is, in our view, the most under-priced risk in the field.
Data Sources and Methodology: Inside the AI Index
Every number on this page traces to a named dataset with a stated year. The composite rankings come from the Global AI Vibrancy Tool, Stanford’s interactive tool covering 36 countries across 23 indicators. You can adjust the relative importance of each pillar yourself and watch the rankings reorder in front of you. Honestly, that’s the fastest way to understand why published lists disagree.
The 2025 evidence on investment, models, AI adoption, and talent comes from the Stanford AI Index 2026. Responsible AI scores come from GIRAI 2026, which covers 135 jurisdictions with 38 indicators. Government readiness comes from Oxford Insights 2025, with the OECD’s 2026 AI Observatory Index as the policy cross-check. These data sources measure different sides of artificial intelligence capability on purpose. We kept them separate on purpose too, and the same data sources back the country profiles on our map.
Put This Data to Work
Reading rankings won’t ship your product. We handle the build: LITSLINK has delivered 1,540+ projects since 2014, including AI agent development and production ML systems for US startups and enterprises.
Planning an AI product for 2026?
Tell us what you’re building, and we’ll respond within one business day with an honest read on scope, stack, and cost. A 30-minute call.
FAQ
Which country is most powerful in AI?
The United States. It ranks #1 in Stanford’s latest Global AI Vibrancy comparison with a final score of 78.60 and leads in 2025 private investment, newly funded companies, notable models, and data-center scale. China is the closest challenger.
Who is leading the world in AI development?
The two global AI superpowers, the United States and China, lead global AI development. The US leads the overall AI ecosystem, while China leads several scale metrics, including publication, citation, and patent output.
Who are the top 5 leaders in AI?
Going by Stanford’s latest comparable rankings: the United States, China, India, South Korea, and the United Kingdom.
What countries are using AI the most?
By population-level diffusion in late 2025: the UAE (64.0%), Singapore (60.9%), Norway (46.4%), Ireland (44.6%), and France (44.0%). Usage leadership differs from technical leadership.
What country is leading in AI right now?
The US leads overall in the newest cross-country evidence. China holds #2 and has narrowed the top-model performance gap to 2.7% as of March 2026.
What country has the most powerful AI?
Frontier leaderboards change monthly, so no single-model answer holds for long. At the country level, the US hosts the most notable models (59 in 2025), and the best US and Chinese models now perform within 2.7% of each other.
Who are the top 5 AIs?
If that means countries: the same five listed above. If it means model developers: OpenAI, Google, Anthropic, Meta, and DeepSeek are the most-referenced frontier labs of 2025–2026.
What country is leading the AI race?
The United States, with China as the strongest challenger. The gap is widest in private investment and infrastructure, and narrowest in frontier-model quality.
Recent articles on AI
See all Posts…
15 Non-Obvious AI Examples In Your Daily Life

30 AI Medical Diagnosis Apps