





Building Irrigation Management Software with DevOps for IoT
- ~28% less water used per season
- ~35% lower cloud infrastructure spend
- 99.9% platform uptime after launch
- 40K+ connected controllers under management
This irrigation management software gives agricultural operators one server-side platform to run every controller, valve, and sensor across multiple sites. Soil moisture, weather data, and crop type feed the watering schedules, so the irrigation system uses less water while crop health stays in view from a phone or a tablet.
Project Details
The Scotts Miracle-Gro Company needed a platform that could replace fragmented, legacy irrigation control with a single AI-powered system. One that connects soil moisture sensors, weather stations, and existing controllers into a cohesive decision engine. The inherited setup relied on calendar-based schedules and disconnected tools, leaving operators without the visibility they needed to improve efficiency.


Business Challenge: Creating Advanced Irrigation Management Software for Agricultural Operations
The client’s controllers already sat on the piping and electrical systems of about 60 farm sites in three states. What was missing was a server-side that could talk to all of them at once, with remote monitoring of every irrigation system in one place. Each site ran its own watering schedules on a fixed calendar. Rain or no rain. A field crew would drive out, open a panel, and adjust a timer by hand. One job could eat half a day. Operators could not compare water management between zones, and the two developers who kept the old backend alive needed about two weeks to ship any change.

Accurate Water Usage Prediction and Optimization
Calendar-based irrigation scheduling ignored soil moisture, weather data, and crop stage. Some zones took 20–30% more water than they needed, others too little, and nobody had the real-time data to tell which was which.

Unifying Hardware and Software Stacks
Controllers, soil moisture sensors, and weather stations came from four vendors and spoke different protocols. Every site had its own dashboard, so crop performance across multiple sites could not be compared.

Multi-User Role Management and Data Security
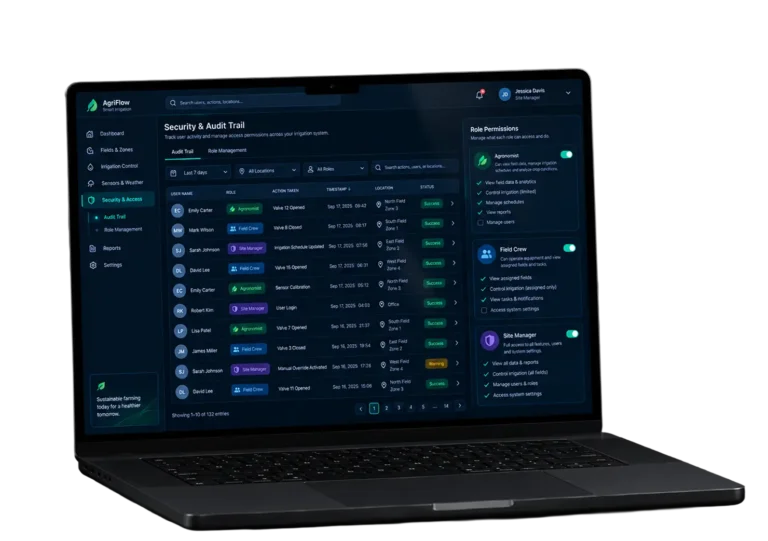
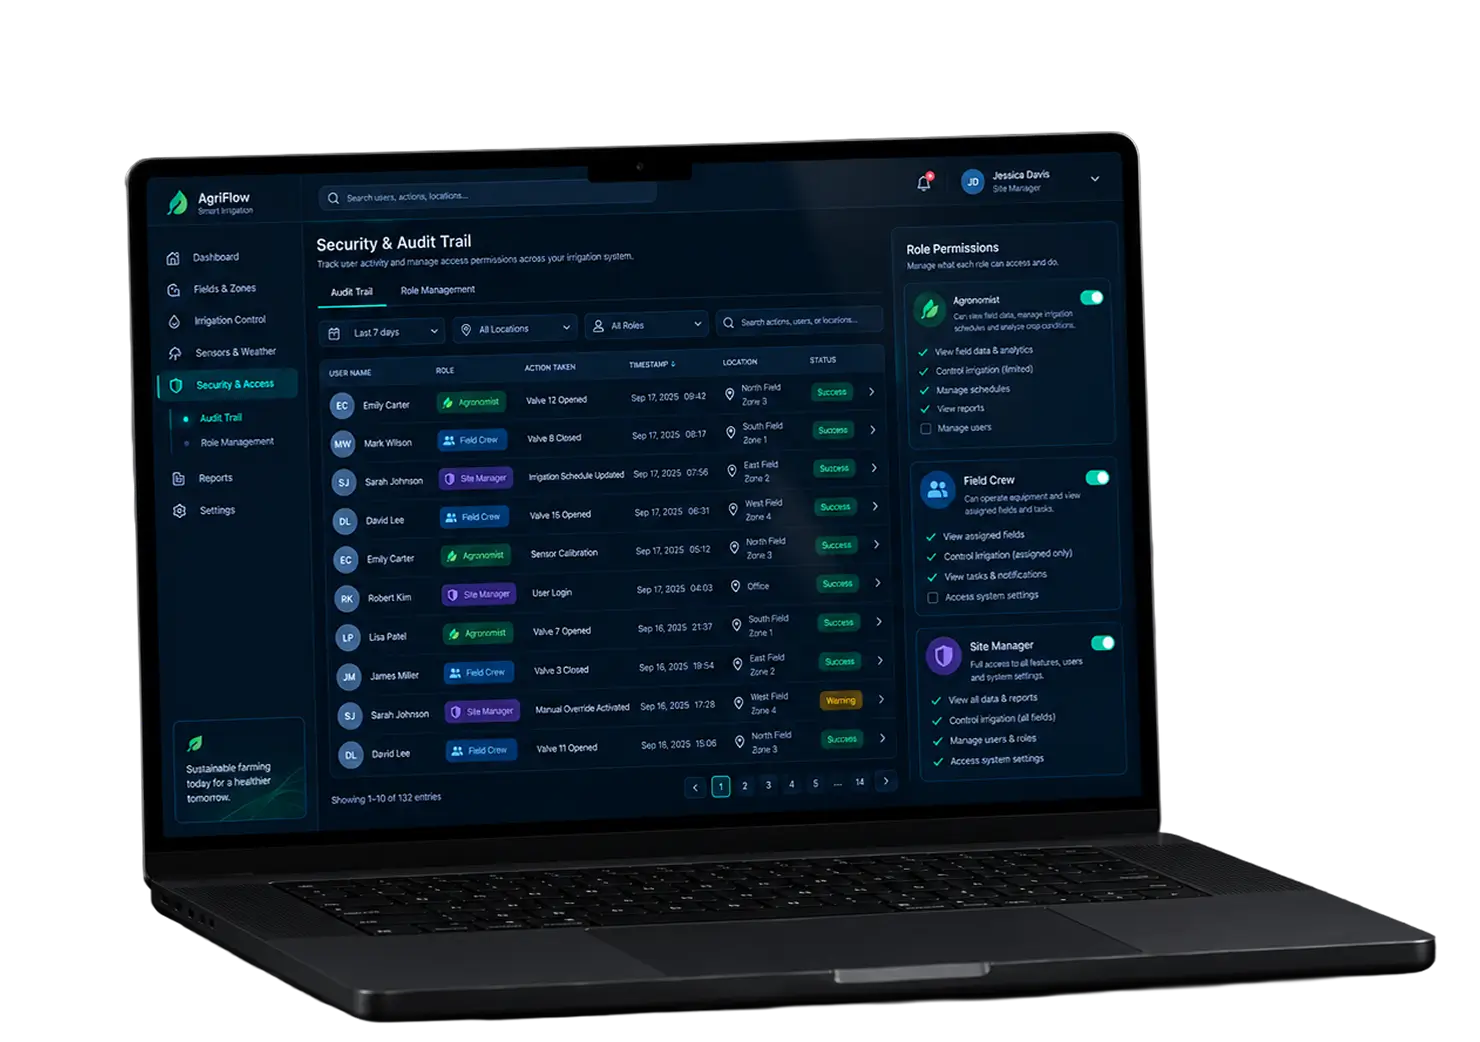
Agronomists, field crews, and site managers needed different access levels. Shared logins gave every user the same access to customer data and remote control of valves, with no audit trail of who changed what.
Technologies Behind the Irrigation Management Software


Our Irrigation Management Software Solution
We built the platform around one question: what does an operator need to see before they trust a machine to open a valve? The answer shaped the whole backend. Every controller became an internet-connected device with a known state, every zone got a water budget, and every automated decision left a record users could check later.
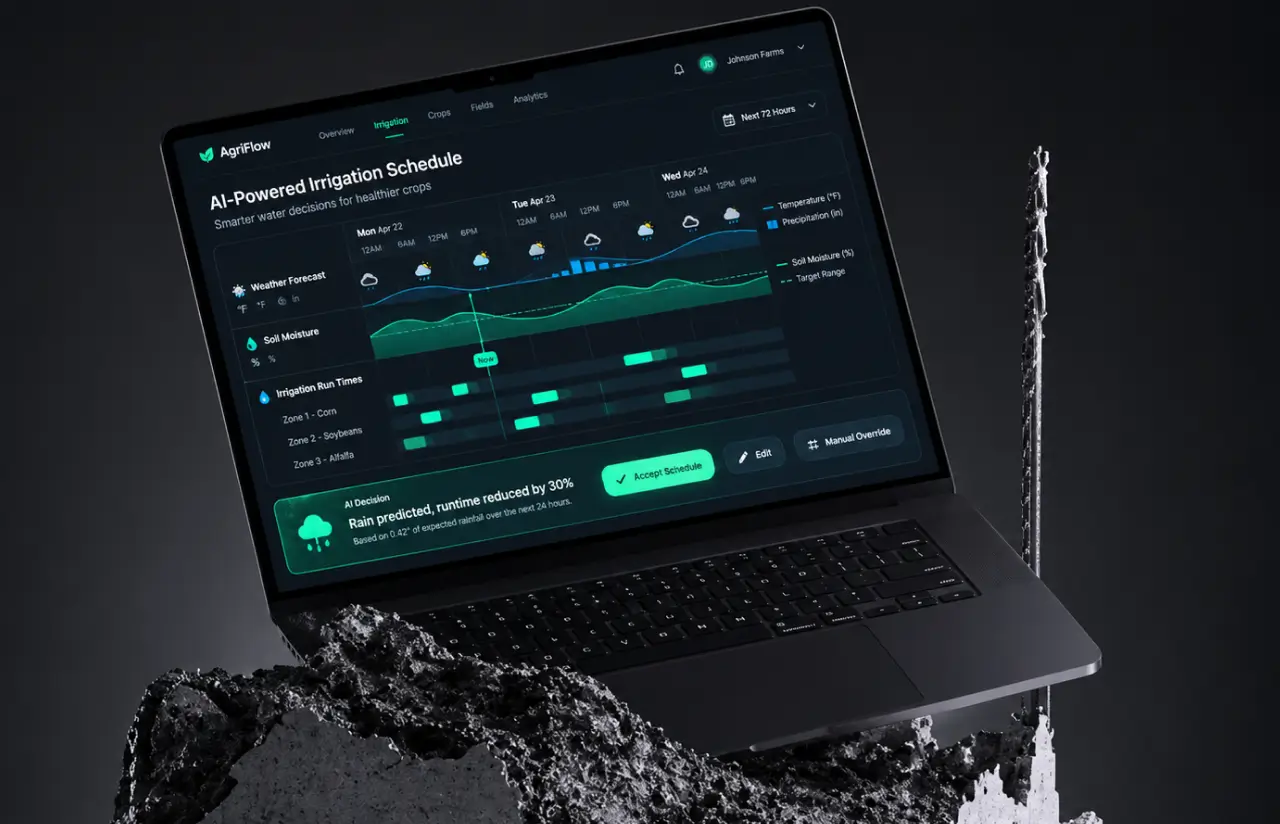
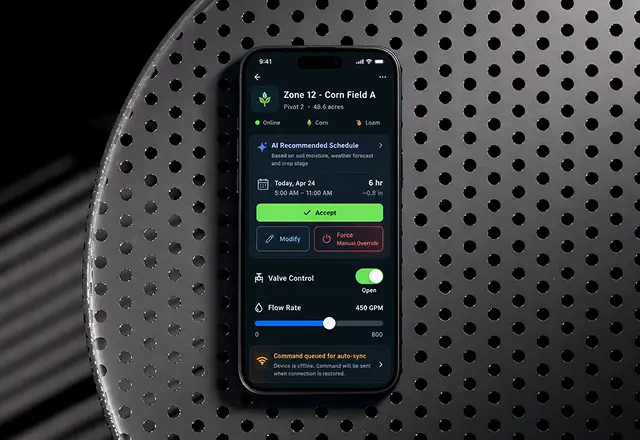
The server side is a set of Python services on Kubernetes. Controllers report over LoRaWAN, sensors push readings every 10 minutes, and a scheduling engine turns that stream into irrigation recommendations per zone. AI models weigh soil moisture, a 72-hour weather forecast, and crop type, then adjust run times. An operator can accept the plan, edit it, or override it from a phone. Smart irrigation systems in agriculture live or die on that trust.
Terraform templates now describe all three environments (dev, staging, production), and GitLab holds code and CI/CD in one place. That part of the work is less visible to farmers, but it is why the release cycle went from about two weeks to same-day, and why a smart irrigation system installation on a new farm now takes a morning instead of a week.
AI-Powered Water Scheduling
Models combine soil moisture readings, weather data, and crop stage to set run times per zone. Schedules update every night, and operators see the reason behind each change, which makes for smarter decisions on the ground.
Real-Time Irrigation Monitoring
Real-time monitoring of valve state, flow rate, and pressure across every controller. If a valve stays open past its window or flow drops 15% below the norm, the platform raises an alert within about 60 seconds, so a small leak stays a small leak.
Mobile and Web Applications
Field crews use iOS and Android apps for remote control of individual zones. Site managers and agronomists work in a web dashboard with maps, reports, and zone history. Both use the same customer data.
Water Conservation Analytics
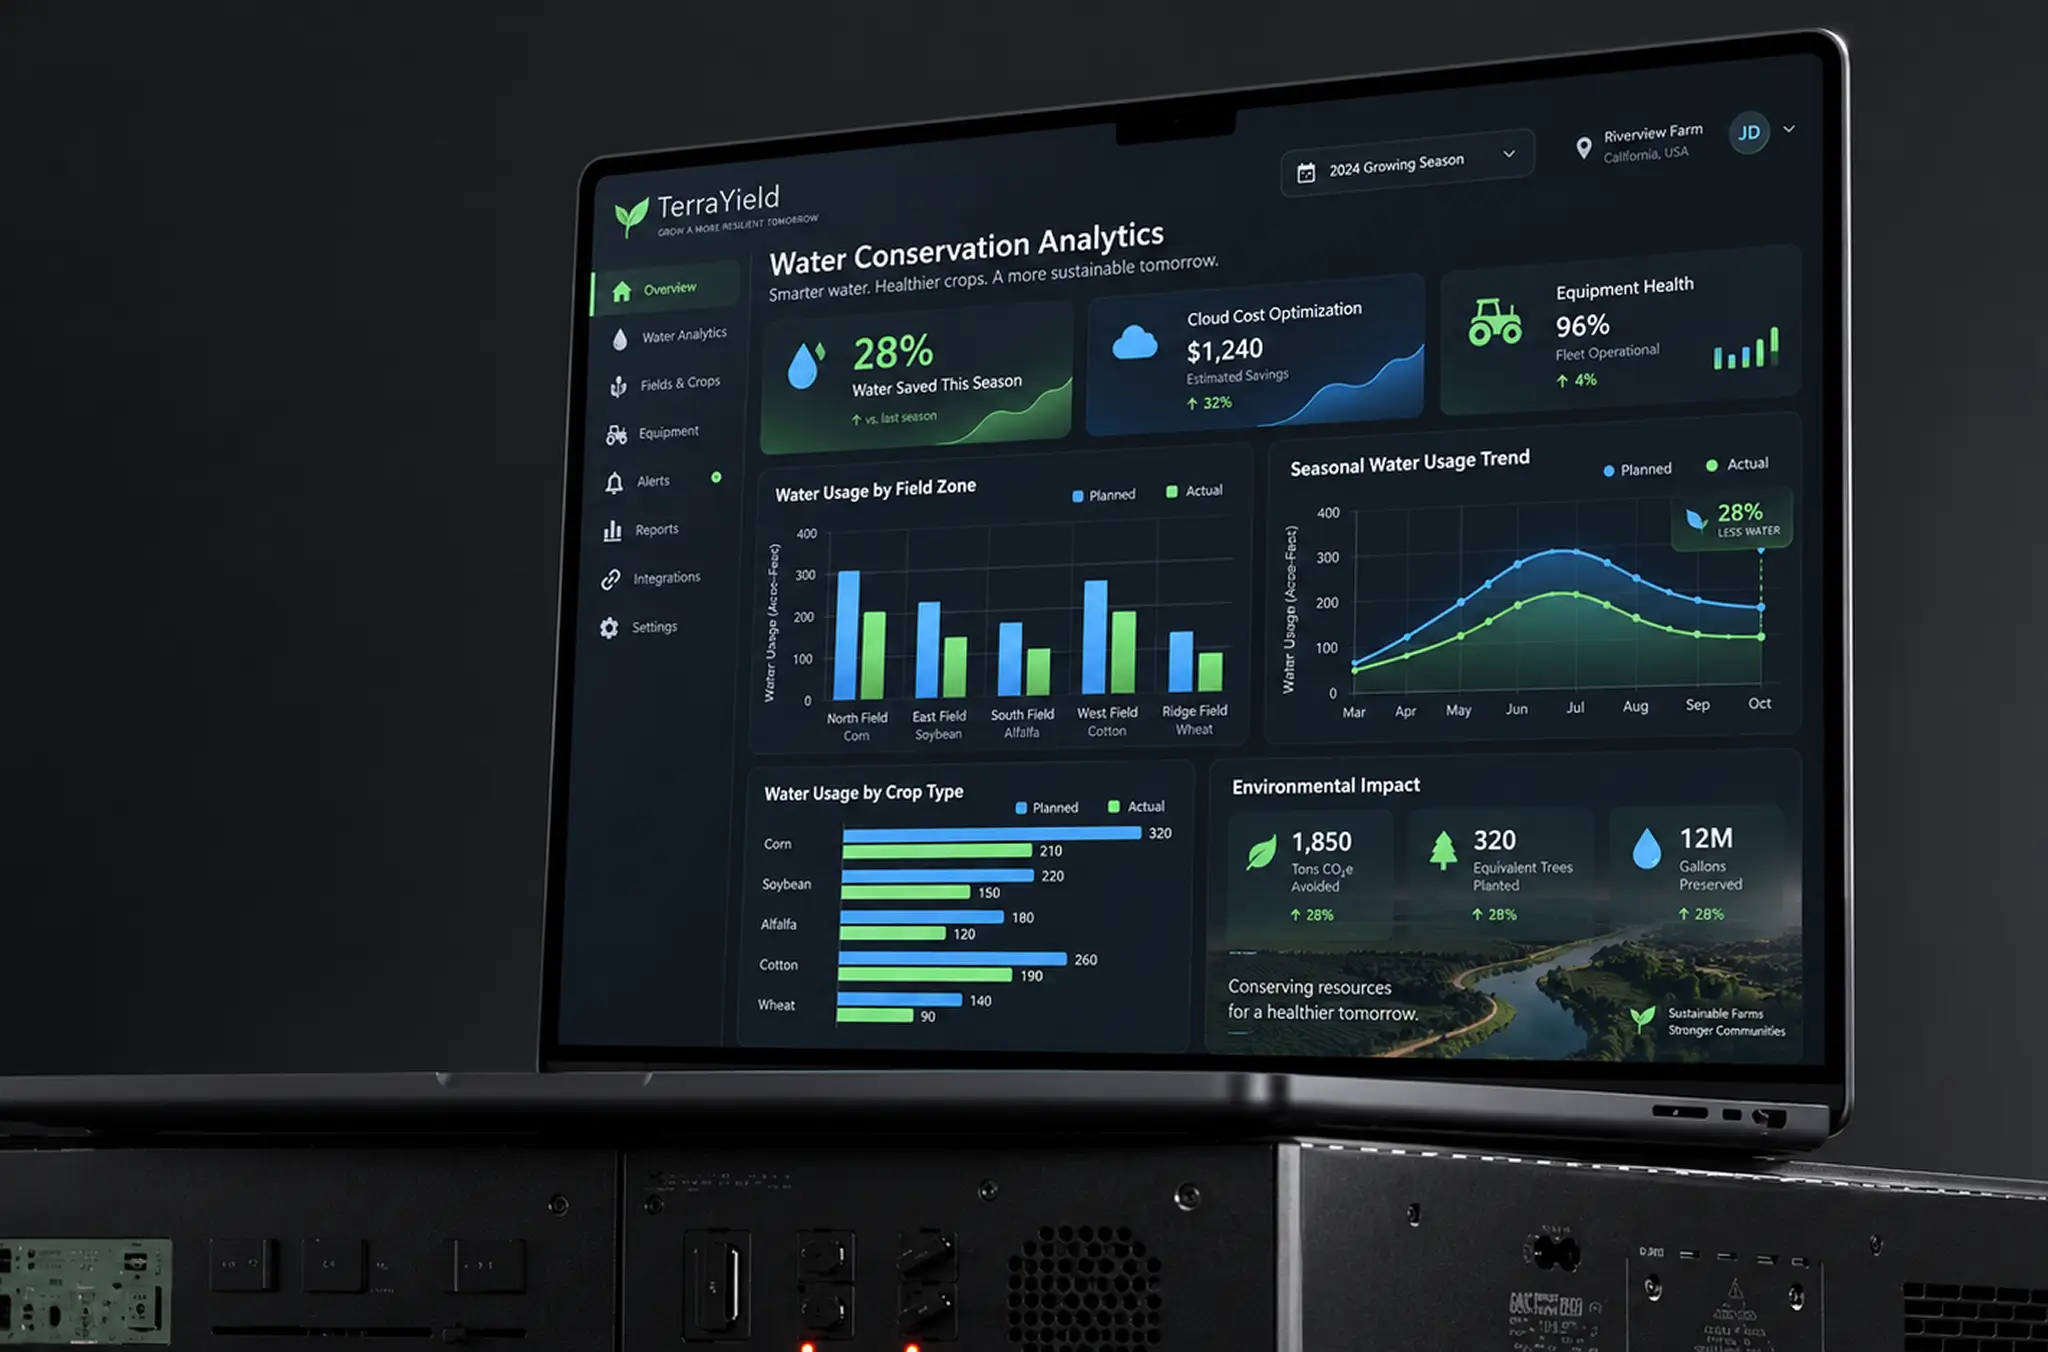
Reports compare planned versus actual water usage by zone, crop, and week. Operators can spot a leaking line or an over-watered block from a chart, which used to take a site visit.
Multi-Site Management Platform
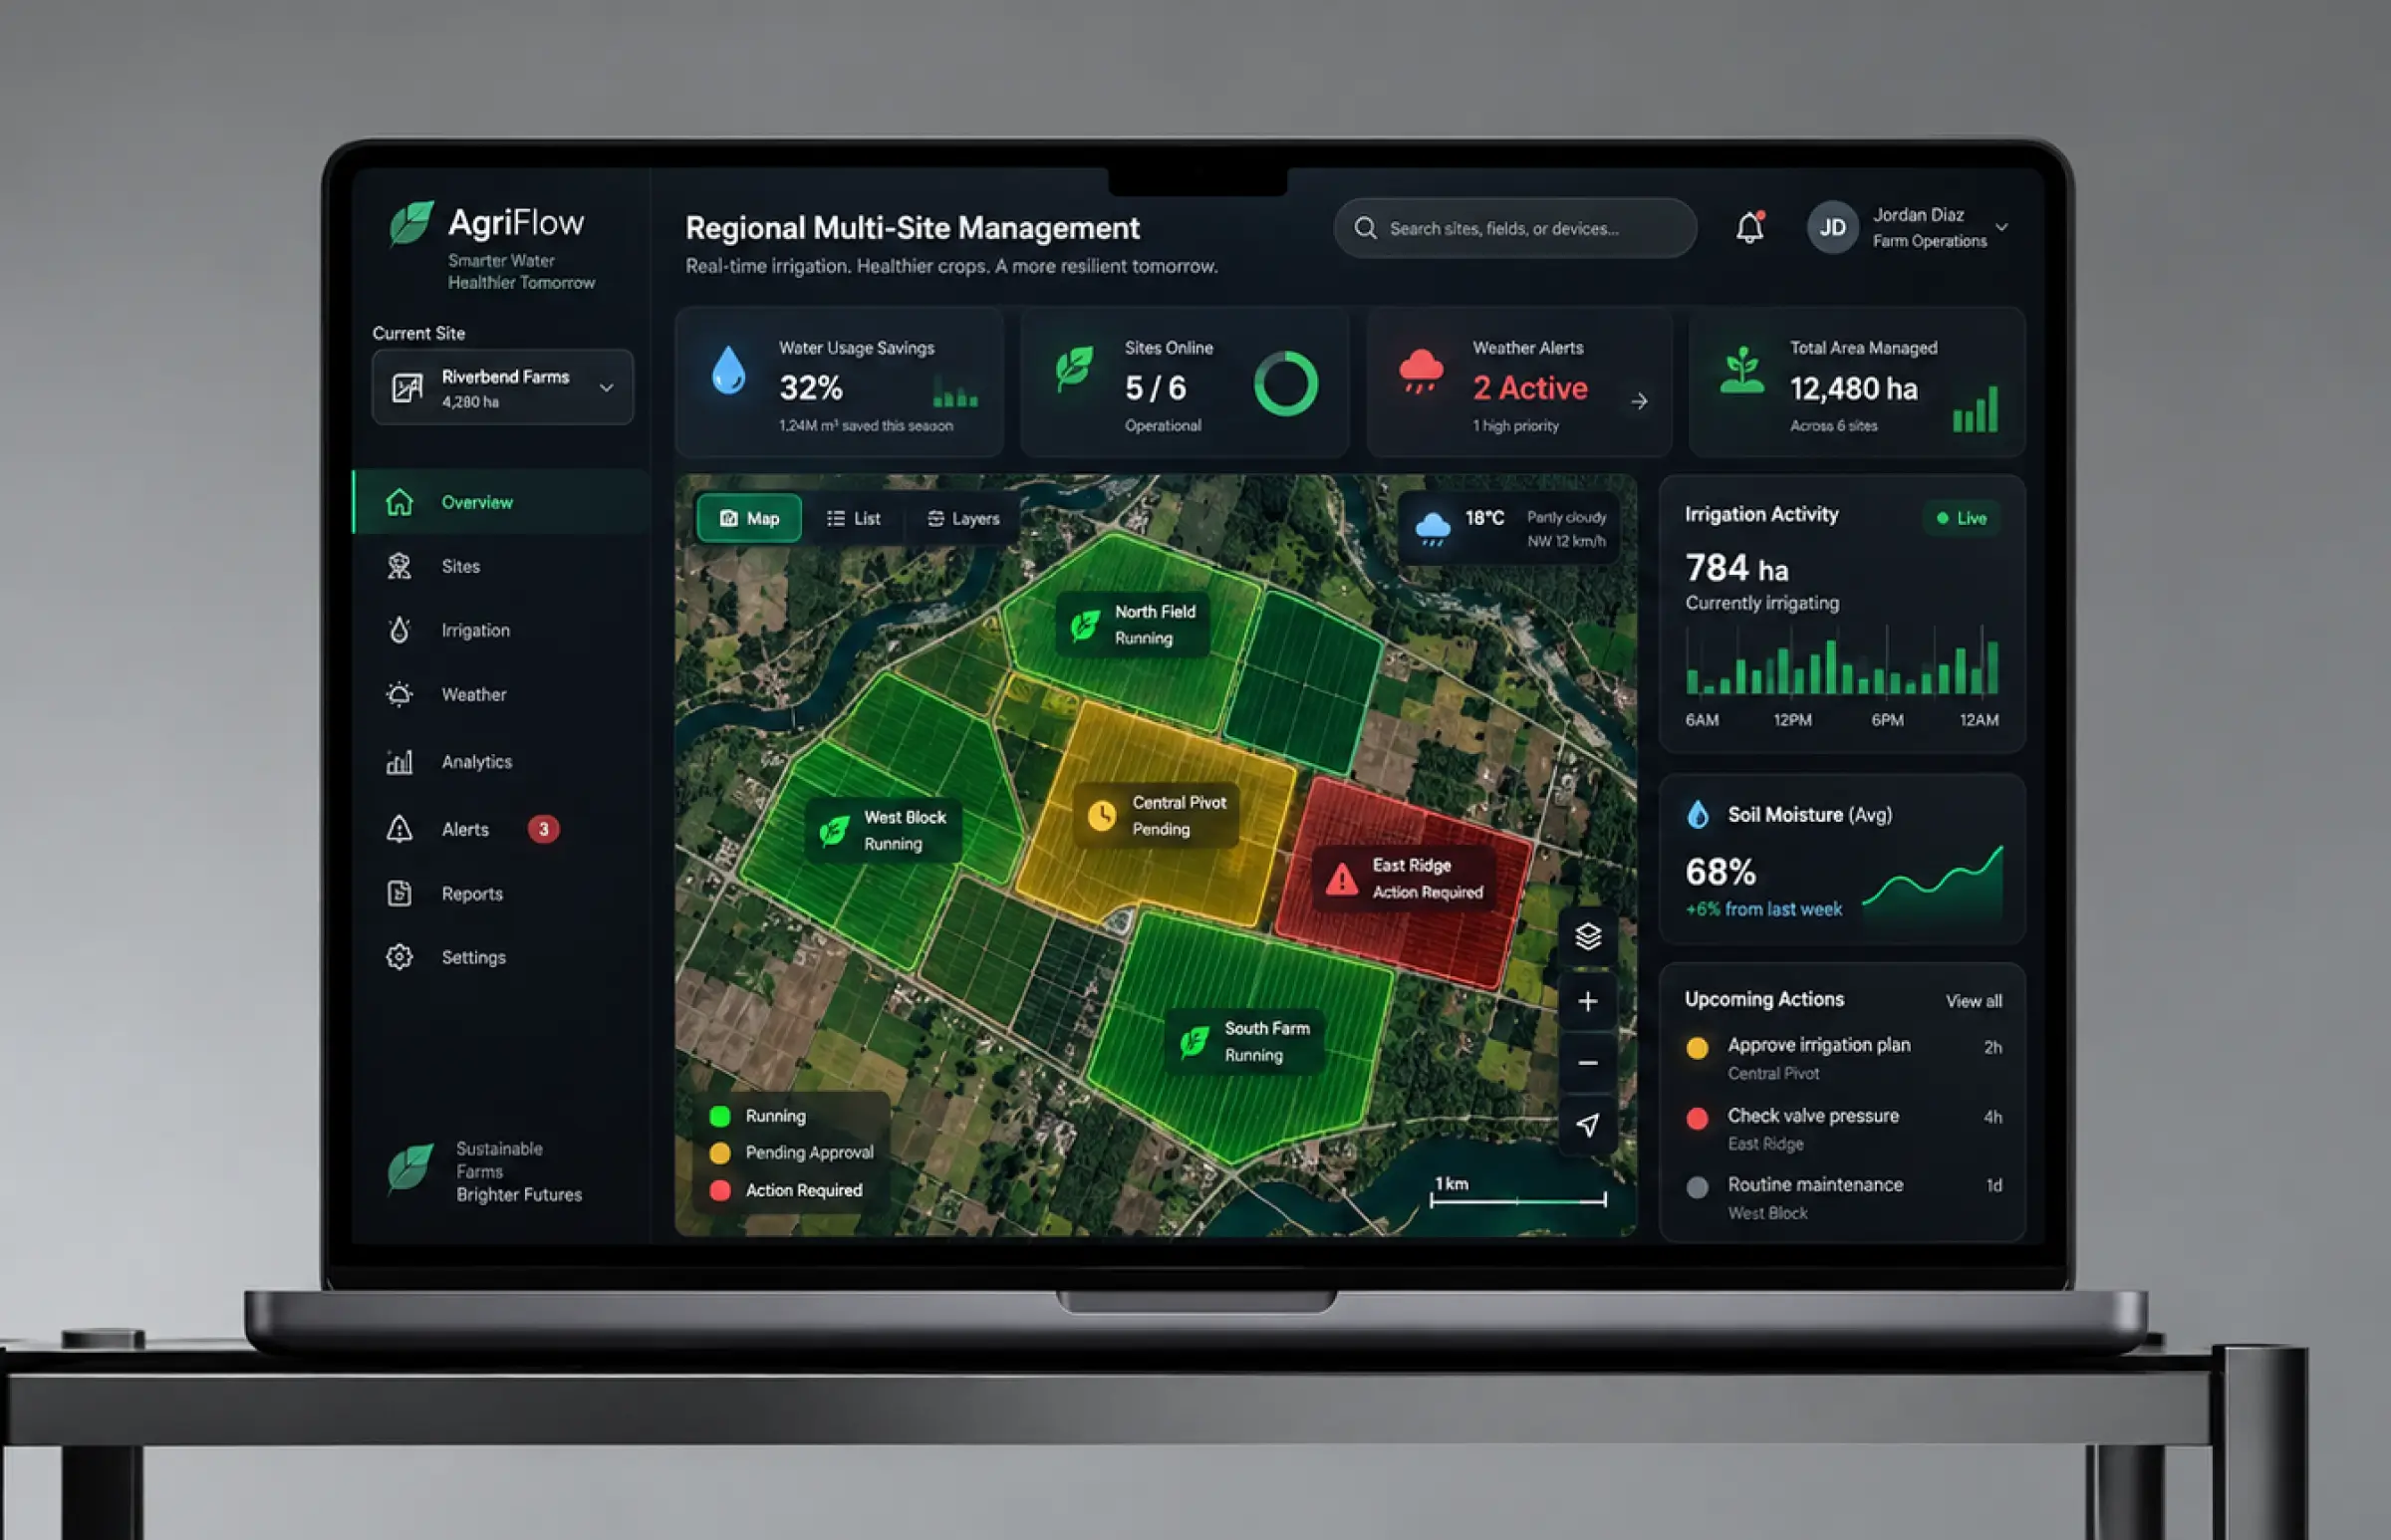
One account covers multiple sites. Regional managers switch between farms in a tap, roll up water use across an entire region, and assign roles per site so a crew in Texas never sees a valve in Arizona.
Hardware Integration Layer
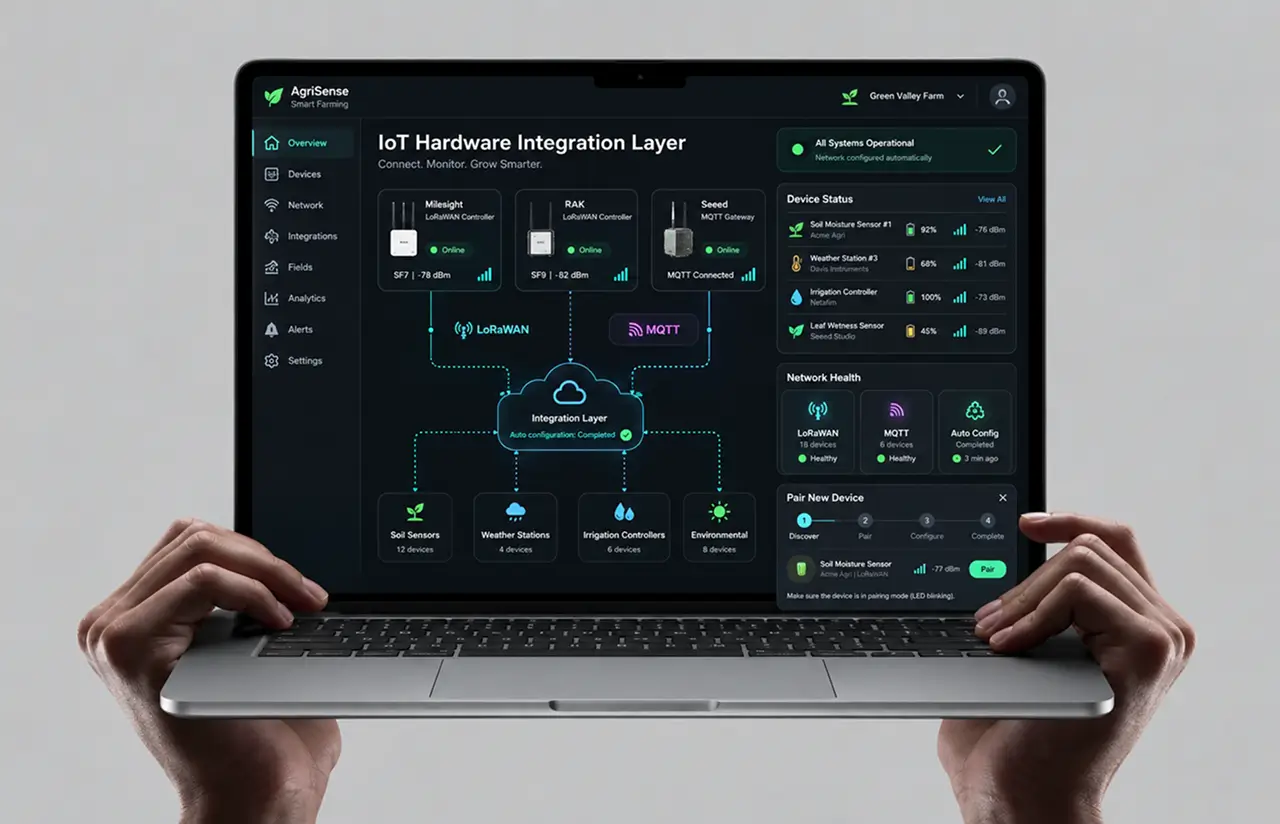
An adapter layer speaks LoRaWAN and MQTT to controllers from four vendors. New devices register in minutes, and the piping and electrical systems on site stay exactly as they are.
Scrum Methodology
Project Journey
We ran the project in two-week sprints, and the first three focused on DevOps groundwork: separate projects per environment, the GitHub-to-GitLab migration, and Terraform for all three environments. Once deploys took minutes instead of days, the team turned to the engine that would handle scheduling, the hardware adapter layer, and the apps. Field pilots started in sprint 9 on two sites.
How the Irrigation Management Software Works
- Soil moisture sensors, weather stations, and valve controllers send readings every 10 minutes over LoRaWAN and MQTT.
- Each reading lands in PostgreSQL against a zone, a crop type, and a device, so history is queryable from day one.
- Every night the engine weighs soil moisture, a 72-hour forecast, and crop stage, then drafts watering schedules per zone.
- The plan shows up in the web dashboard and the phone app with the reasoning attached. Accept, edit, or override.
- Controllers execute run times. Flow and pressure stream back, and the platform flags anything that drifts off plan.
- Weekly water usage, crop performance, and equipment health reports go out per site and per region, so managers can monitor trends without logging in.
Development Process Flow
The order of work on this project was deliberate: DevOps for IoT came first, because nobody wanted to test a scheduling engine on a backend that took two weeks to deploy. Each sprint ended with a demo on real controllers in the client’s test plot, and the client’s agronomist joined every review. Field pilots on two live sites ran from sprint 9 onward, so the last 15 sprints were shaped by crews using the phone app in the field.
How we delivered Irrigation Management Software Solution
- We define the project goal together, agree on priority features, and set a realistic delivery date and budget.
- We build a ranked list of everything the product needs, starting with what matters most to the business.
- Work is broken into 2-week cycles. At the start of each, we select the next set of features to deliver.
- The team builds, tests, and integrates features throughout the sprint.
- At the end of every sprint, you see working software and give feedback that shapes the next cycle.
- Each sprint produces a shippable piece of the product. We review what worked, adjust, and move forward.
UI/UX Design: Intuitive Interface for Irrigation Management Software
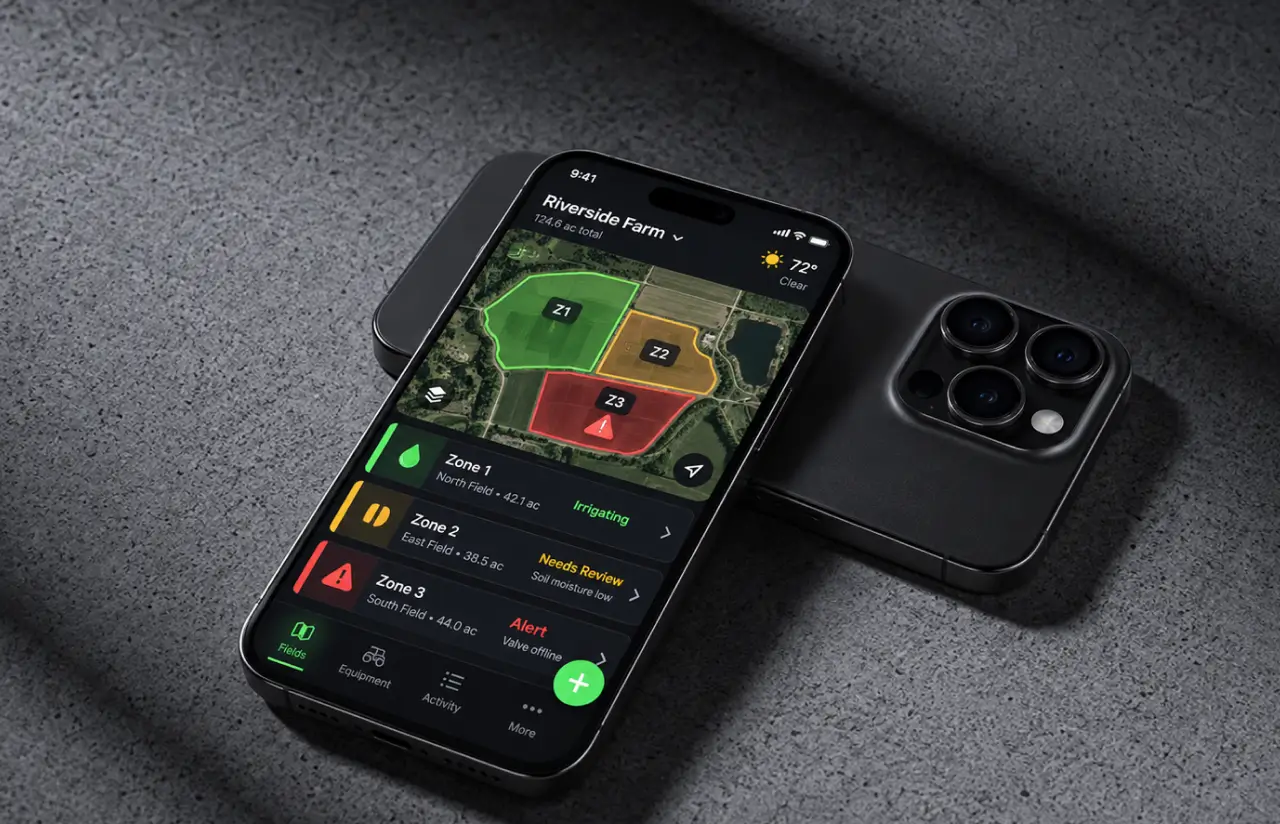
The design brief came from watching a crew lead in a pickup at 6 a.m. He wanted to know three things: what is running, what is wrong, and what needs a decision. So the phone app opens on a site map with zones colored by state. Green is running on plan, amber is waiting on approval, red needs a person. One tap opens a zone; one more starts or stops it. Text is large, buttons are far apart, and the app works with gloves on. Crews stay connected even where the signal is thin, because commands queue and send when the phone or tablet is back online.
The web dashboard is where agronomists and managers spend time. Our product design team put water usage, soil moisture, and weather on one timeline per zone, so a manager can see why a schedule changed without opening a report. We ran each screen through two rounds of testing with site staff. The first schedule view scored badly because it hid the reasoning, which is why every automated change now shows its inputs.
Results
Before
- ✕Watering schedules set on a fixed calendar, adjusted by hand at the panel
- ✕One schedule change took 1–2 site visits and roughly half a day of a crew's time
- ✕Backend deploys took ~2 weeks and were done by hand
- ✕Four vendor dashboards, no view across multiple sites
- ✕No audit trail for who opened which valve
After
- ✔Schedules rebuilt nightly from soil moisture, weather data, and crop type
- ✔Remote control from a phone. Under 60 seconds to change a zone
- ✔Same-day deploys through GitLab CI/CD, ~35% lower cloud spend
- ✔One platform for ~60 sites and 40K+ devices
- ✔Role-based access with a full log of every command
Impact of the Irrigation Management Software After Launch
Verified Reviews
Our Reputation on Top Platforms
LITSLINK holds a 4.8 rating on top platforms, and is listed as a top cloud and IoT development partner on both. Clients mention the same things in reviews: engineers who understand hardware constraints, clear communication across time zones, and delivery that stays on schedule.
Have a Smart Management Project in Mind?
Need irrigation management software, a custom agritech solution, or a backend for any fleet of connected devices? Send a few lines about your hardware, your sites, and what you want to automate, and our specialist will get back to you within 48 hours.
Thank you for your message. It has been sent.