






Building an AI-Based Real-Time Defect Detection Solution for Manufacturing
- 96.4% detection accuracy across 11 defect classes
- 45 ms per frame on the line-side inference box
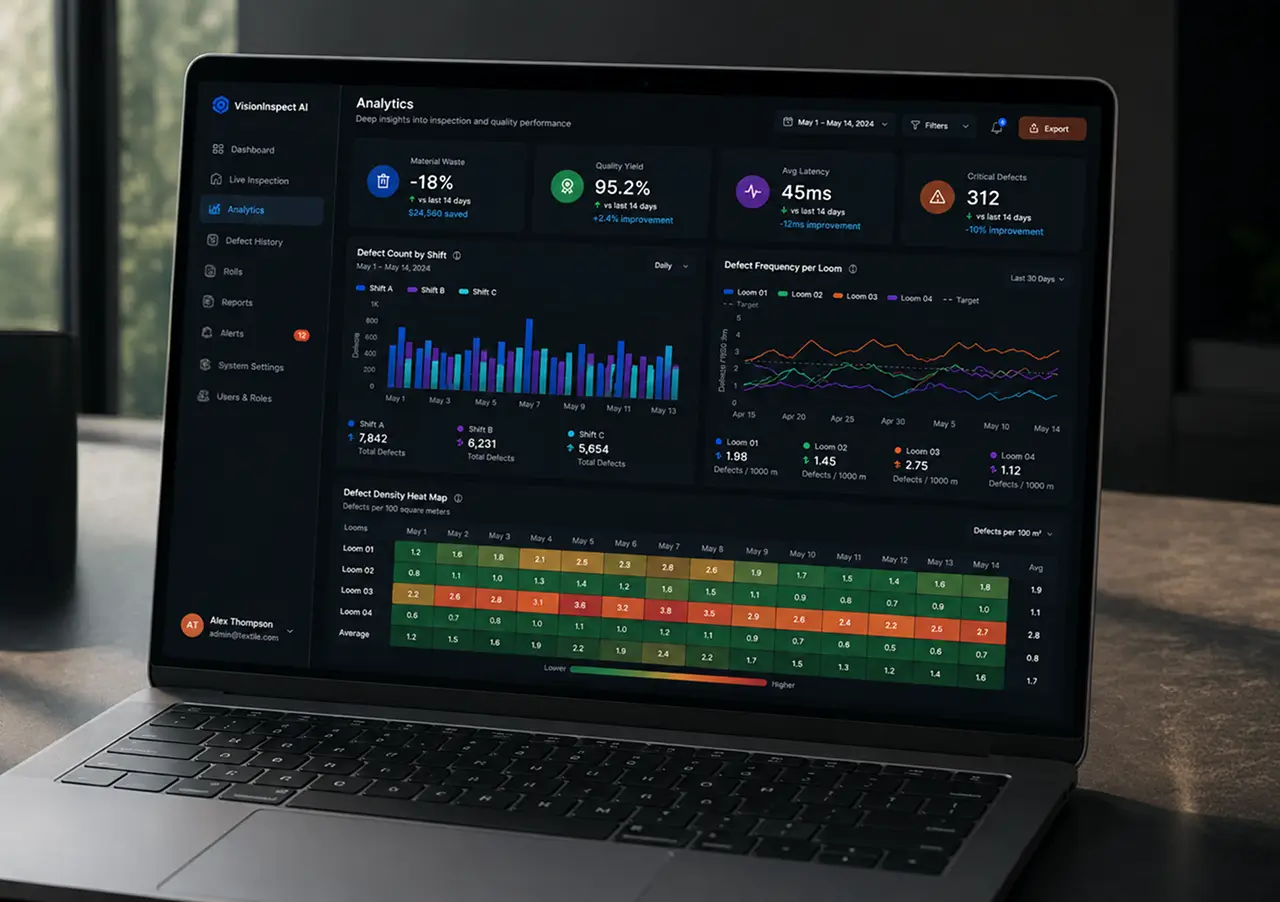
- ~18% less material waste in the first quarter after launch
- 9% to 5% of output downgraded to second grade
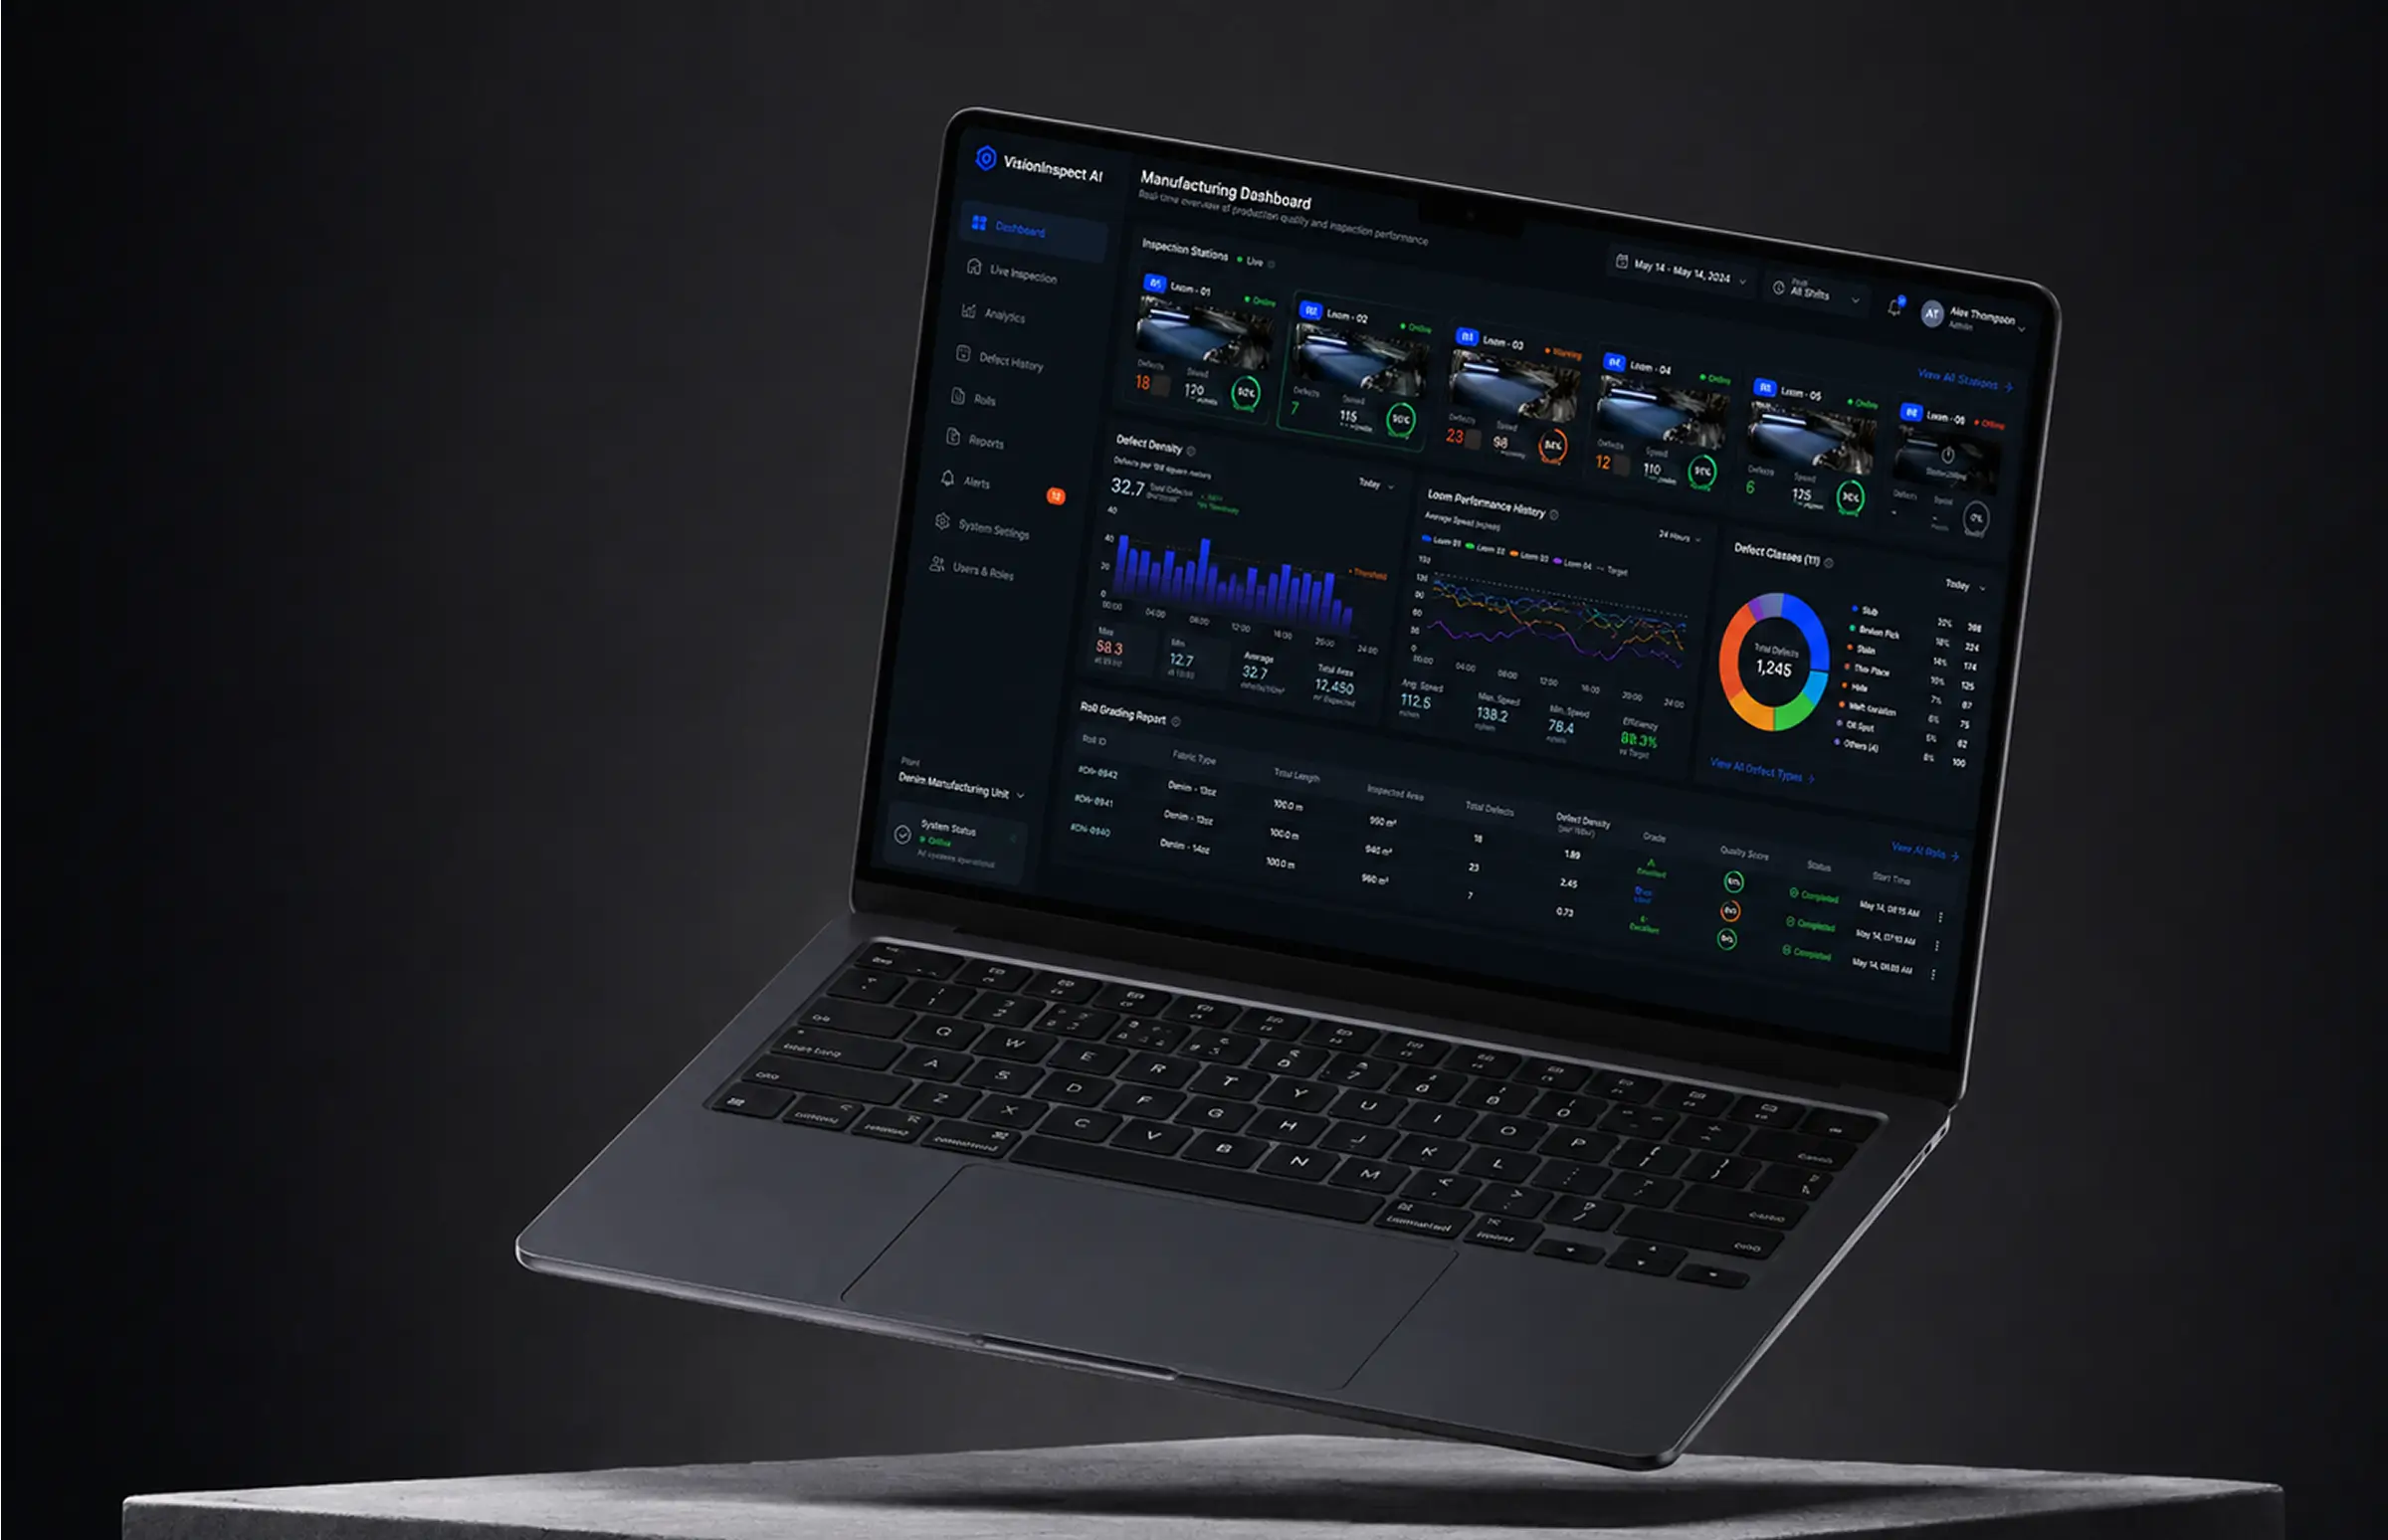
- 6 inspection stations watched from one browser tab
Fabric comes off a loom faster than any pair of eyes can check it. We built one of those defect detection solutions for manufacturing teams to keep running past the pilot: a computer vision system that watches the production line, boxes every surface defect as it passes the camera, and sorts objects into one of eleven classes taken from the client's engineering criteria.
Project Details
The client mills and finishes denim. Twenty rolls pass the inspection stage on a normal shift, and until this project, two people checked all of it by eye.


Technologies Behind the AI Solution for Manufacturing Quality Control





Business Challenge: Creating a Manufacturing Real-Time Defect Detection System
The mill’s quality problem had an address. It sat between the loom and the cutting room, at a light table where fabric moved past two inspectors at roughly 15 meters a minute. Manufacturing defects were counted at the end of a shift rather than tracked as they happened.
That arrangement worked for years, in the sense that it produced a number at the end of every shift. What it never produced was a record. Faults were chalked onto the selvage and copied into a paper log, so nobody could say which loom accounted for most manufacturing defects last month. Attention was the second issue. Both inspectors stayed sharp for about two hours, and by hour six roughly one surface defect in three went past unmarked. Traditional quality control methods gave the QA lead no way to prove otherwise, either.
Manual inspection has a ceiling that no amount of training raises. Hidden defects under a fold, or a thin place that only shows against the light, stay invisible to traditional methods at 15 meters a minute. Detecting defects at the loom costs a fraction of what it costs to find the same fault at cutting, after the mill has already paid to finish the roll. A thin place does not always compromise product quality, by the way, and that judgment is exactly what the tolerance table encodes.

Manual Inspection Missed Defects
Two inspectors per shift watched fabric slide past a light table. Focus held around two hours. After that, roughly one fault in three slipped through, and human error was impossible to separate from fatigue in a handwritten log.

No Production Data Trail
Faults were chalked on the edge of the roll and written down by hand. No defect density figures, no per-loom history, no process control worth the name. Every quality conversation started from memory.

Late Detection, Wasted Material
Most product defects were confirmed after finishing, when a whole roll had to be regraded. About 9% of output shipped as second grade. Buyers working to stringent quality standards returned some of it, and material waste followed the same curve.
Solution: Machine Vision Automated System for Visual Inspection of Product Quality
Where does the inspection happen? That shaped the architecture. Cloud round-trips work for a report and fail on a line running 25 meters a minute, so the model runs at the line, on a Jetson box beside the camera, with AWS behind it. The mill had trialed automated visual inspection software two years earlier. It flagged everything, and traditional inspection methods were back inside a month.
The spec listed eleven classes with tolerances, and the QA lead knew each by sight. A slub and a broken pick are both faults. Only one stops a shipment. AI for defect detection in manufacturing works only when the training data comes off the same line the system watches, so six weeks went into footage first: 24,000 labeled instances across 9,000 frames, 3,100 held back.
Defect detection in manufacturing has a hardware problem before a model problem, and the camera rig took as long to settle as the machine learning pipeline behind it. Lighting was the critical aspect: denim shifts tone as bulbs age, so OpenCV normalizes contrast. Object detection and classification then run in one pass, returning a box, a class, a confidence score, and precise dimensional measurements across the roll. Deep learning handles identifying defects. Grading rules stay in plain code, because identifying defects and grading a roll are separate jobs.
The classes cover point faults you could hide under a thumbnail, structural flaws running the roll’s length, and dimensional defects where width drifts outside spec. Complex defects, a slub inside a shade band, took the most examples. Rule-based systems had failed here: change the fabric weight and every threshold stops meaning anything. Machine learning algorithms trained on this mill’s fabric and lighting behave differently, though AI systems that watch a physical process age with it. The camera reads the surface, so internal defects like weak yarn need a different sensor.
Real-Time Surface Inspection
Line-scan cameras cover the full width of the moving fabric. Each frame is processed in about 45 milliseconds, so a fault appears on the operator screen roughly a second and a half after it passes under the lens.
Eleven-Class Defect Classification
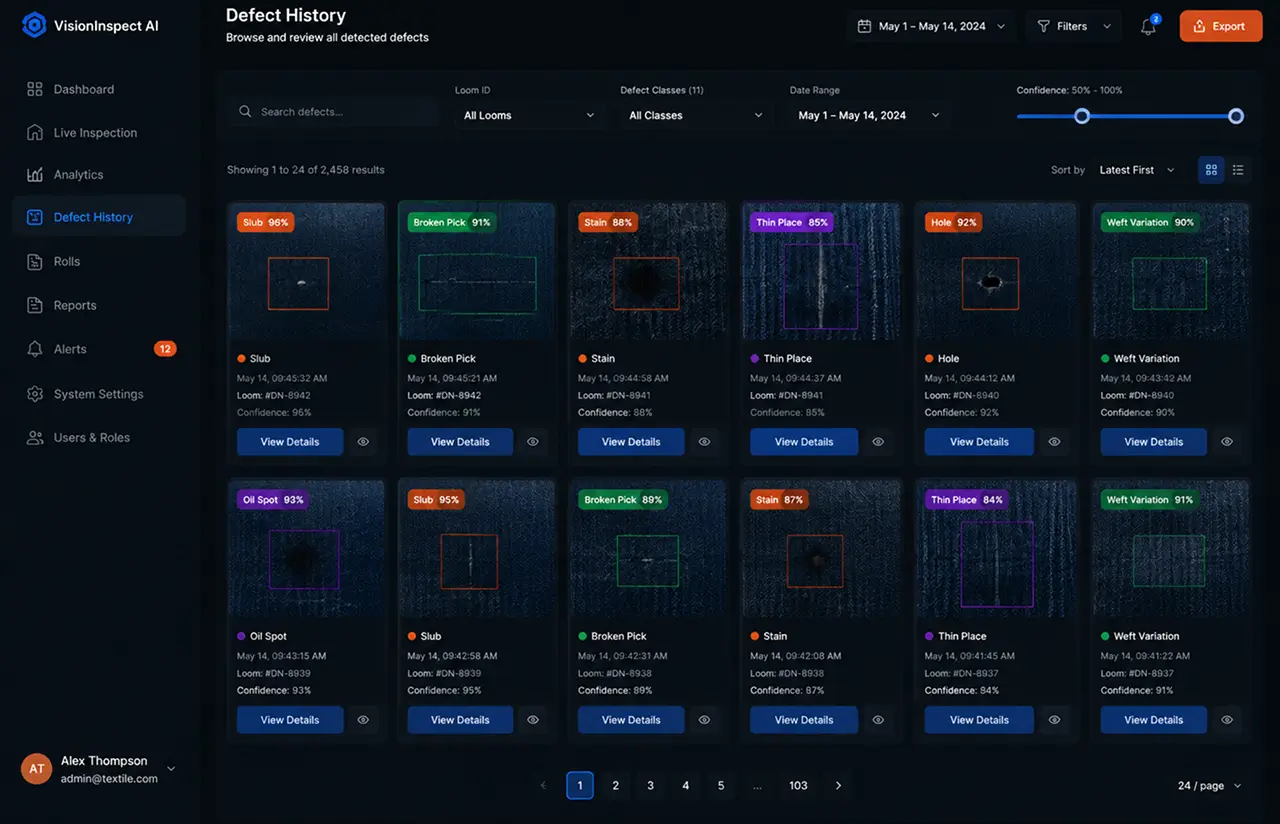
Every detection lands in one of eleven classes taken from the client's own spec: slubs, holes, oil stains, broken picks, thin places, contamination, and the rest. Class, confidence, and frame are stored together.
Severity Grouping and Roll Grading
Classes roll up into three color-coded families on screen, then into a points score per roll. That grade decides where the roll goes next, so a supervisor reads a decision instead of a list.
Defect Density and Trend Analysis
Most defects occur in bursts, so the dashboard charts them per hundred meters, per loom, and per shift. Two weeks after launch, the mill found one loom running four times the average. A worn bearing, as it turned out.
Remote Monitoring Dashboard
Six inspection stations report into one browser tab. A plant manager off-site sees live progress on every roll, current counts by severity, and which line has stopped.
Roll Reports and ERP Export
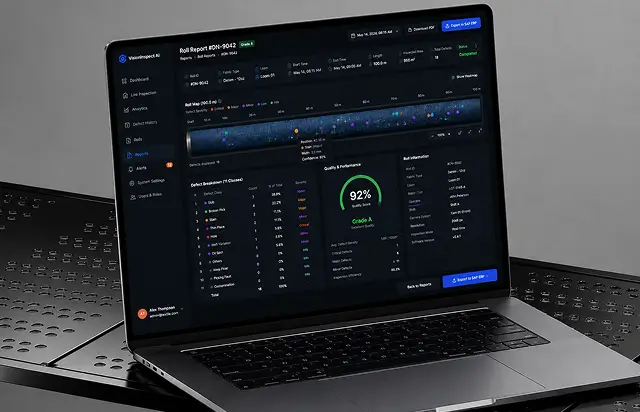
One click writes the roll report: defect map, counts by class, grade, timestamps. Under ten seconds, against the twenty-odd minutes of paperwork it replaced. CSV, PDF, or straight into the mill's ERP over the API.
Scrum Methodology
Project Journey
The seven-month, fourteen-sprint project began with four sprints of factory data collection, since stock fabric images would not work. Discovery defined the eleven defect classes, acceptable false positives, hardware placement, and latency requirements. Every sprint demo used fresh mill footage rather than curated test data, exposing real-world issues such as inference box reboots that accuracy scores alone would miss.
How We Delivered this Computer Vision Quality Control Project
- We define the project goal together, agree on priority features, and set a realistic delivery date and budget.
- We build a ranked list of everything the product needs, starting with what matters most to the business.
- Work is broken into 2-week cycles. At the start of each, we select the next set of features to deliver.
- The team builds, tests, and integrates features throughout the sprint.
- At the end of every sprint, you see working software and give feedback that shapes the next cycle.
- Each sprint produces a shippable piece of the product. We review what worked, adjust, and move forward.
Scrum Process Flow
Artificial intelligence development on a factory floor cannot wait for a big release, because the only honest test happens while the line is moving. Two-week cycles put a working build in front of the QA lead often enough that model behavior got corrected early, back when retraining still cost days instead of weeks.
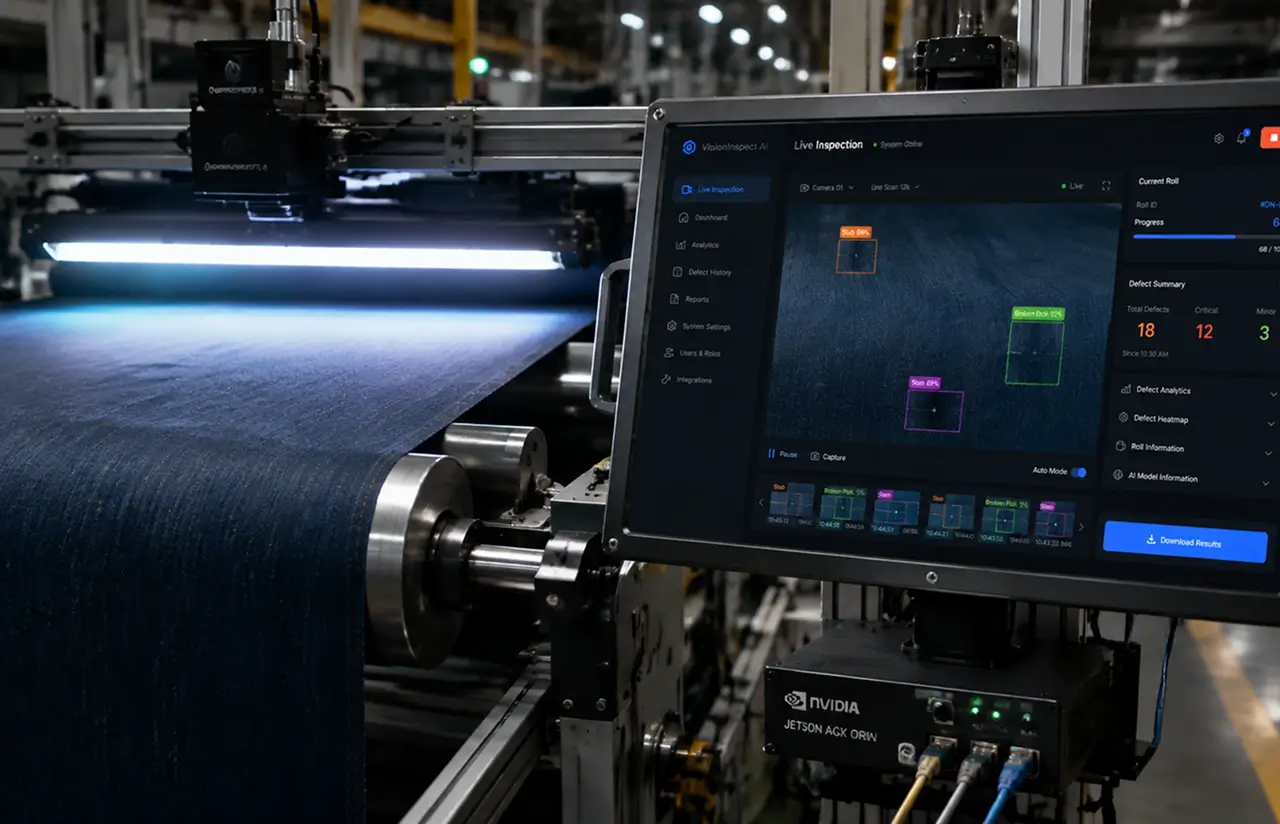
How Our AI Quality Inspection System Works
- Line-scan cameras cover the full roll width and feed frames continuously while the line runs at up to 25 meters a minute.
- Preprocessing normalizes contrast and lighting, then hands each frame to the model running on the Jetson device beside the line.
- The detector returns a box, one of eleven classes, a confidence score, and the size and position of the fault on the roll.
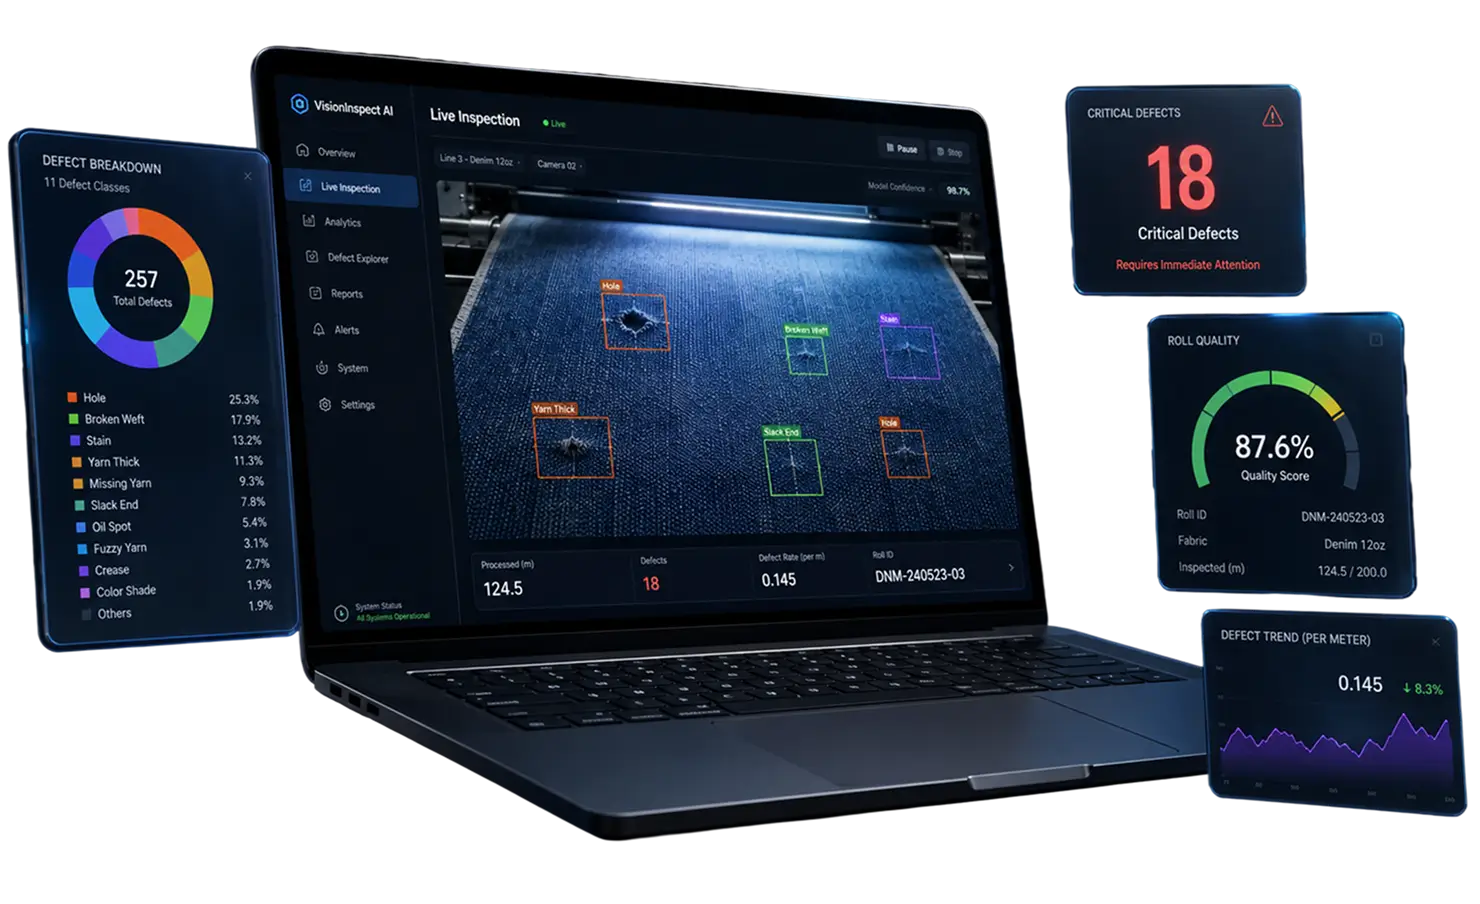
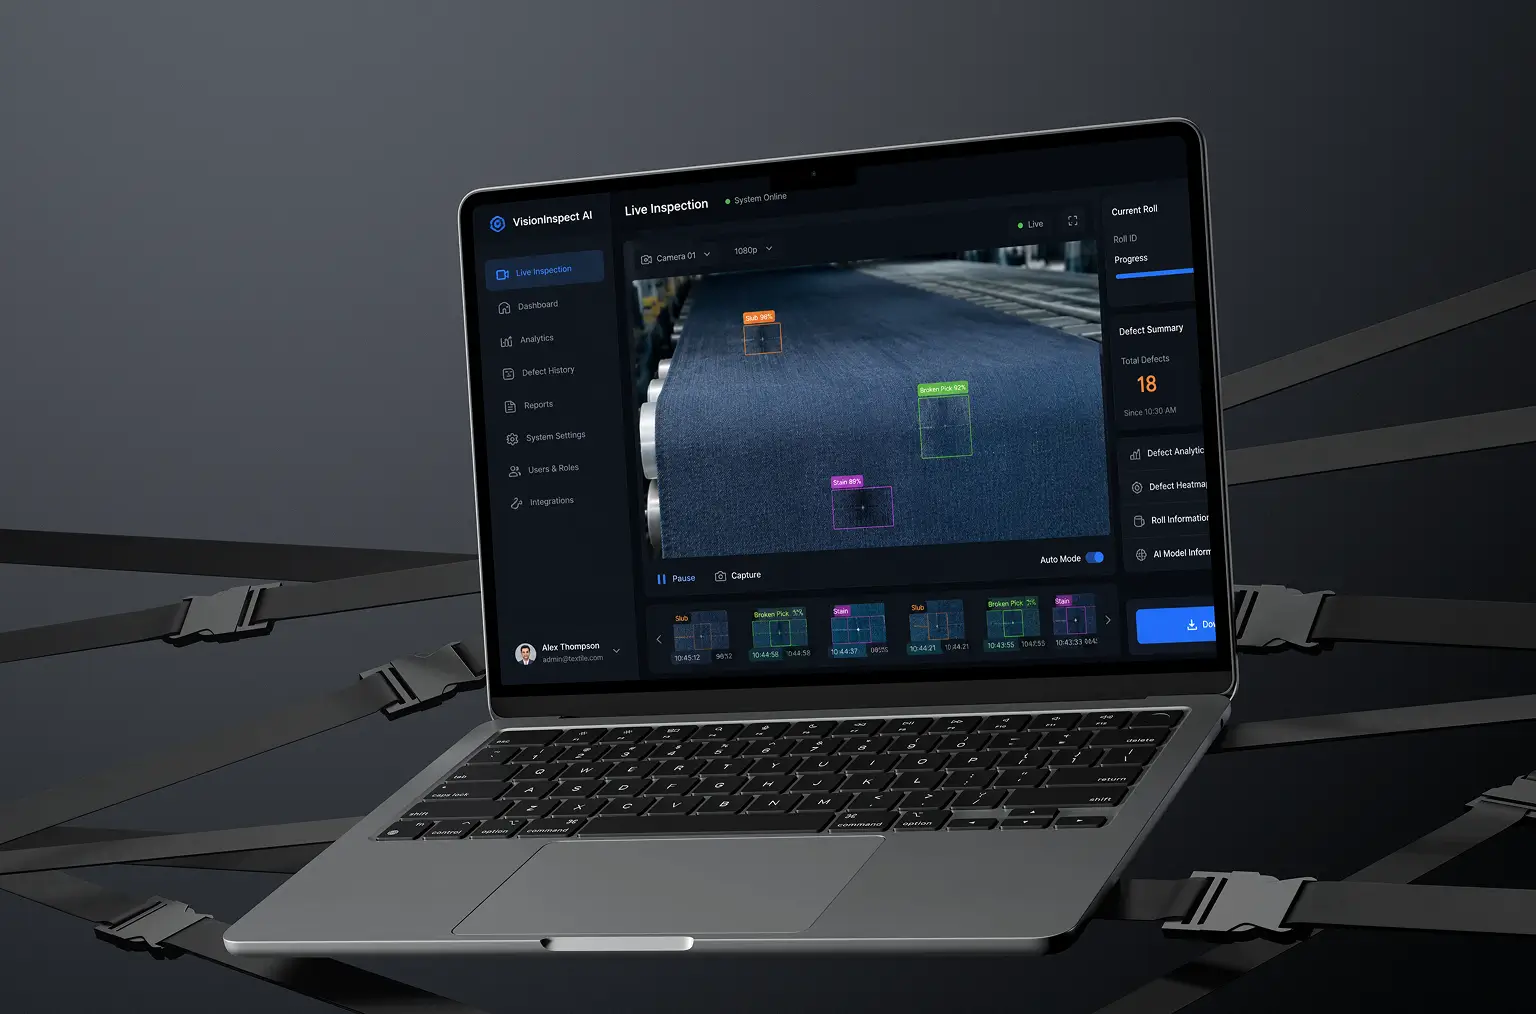
- Detections group into three colored families. Counts refresh beside the roll name, so the operator sees 18, 12, and 3 rather than a raw feed.
- Anything under the confidence threshold gets a second look. Human inspectors confirm or clear it, and every correction is stored for the next training round.
- Points are totaled, the roll gets its grade, and the report exports to PDF, CSV, or the ERP. Download Results sits at the bottom of the panel.
UI/UX Design
The interface has one job: tell an operator what just went past the camera without making them read. Surface defects are drawn straight onto the fabric view in three colors. Orange squares for point defects, a green box around yarn and thread faults, and magenta for a lengthwise line that runs meters rather than millimeters. Operators learn the mapping inside one shift. The quality inspection process now starts at that screen instead of at a light table.
The right panel carries the state of the current roll: inspection progress as a percentage, roll name and timestamp, then the three counts. Four drawers sit below it, collapsed by default, because during a run nobody opens them. Trend Analysis, Formation Analysis, Defect Density, Roll Grading. Stop sits top right in orange, the only warm color on the screen, and Download Results anchors the bottom in blue.
One argument ran across two sprints, over the color of the boxes. Red was the obvious choice and the wrong one. Plenty of the fabric coming through carries red thread in the selvage, and a red box on a red thread reads as noise. Orange, green, and magenta survived the floor test because none of them show up in denim at any stage.
Timeline
Five phases, clearly defined
Discovery & Product Workshop
- Walking the line and timing the existing inspection process
- Agreeing the eleven classes and the tolerance behind each one
- Deciding where the inference hardware physically lives
Data Collection & Labeling
- Six weeks of line-scan footage across articles and shifts
- 24,000 labeled instances, reviewed by the mill's own QA staff
- 3,100 frames held back as an untouched test set
Agile Development (Sprints)
- Detector training, quantization, and TensorRT conversion
- Operator dashboard, severity grouping, and roll grading rules
- Remote monitoring, reporting, and the ERP export endpoint
QA & Line Testing
- Shadow running beside human inspectors for three weeks
- False positive tuning against real production processes
- Failure drills: camera loss, network drop, box reboot
Launch & Support
- Deployment across six inspection stations
- Operator training and a written escalation path
- Scheduled retraining as new articles enter production
Results
Before
- ✕Two inspectors per shift checking fabric by eye at a light table.
- ✕Roughly one surface defect in three reaching the cutting room.
- ✕Faults chalked onto the roll, then copied into a paper log.
- ✕About 9% of output downgraded to second grade after finishing.
- ✕No defect density figures, no per-loom history, and no remote view of the line.
After
- ✔96.4% accuracy across all eleven classes on the untouched test set.
- ✔45 ms per frame, putting a fault on screen about 1.5 seconds after it passes the camera.
- ✔Every detection stored with class, size, position, and timestamp.
- ✔Second-grade output near 5%, with material waste down roughly 18% in the first quarter.
- ✔One dashboard covering six inspection stations, on site or remote.
Impact of AI Solution for Manufacturing Defect Detection
Verified Reviews
Our Reputation on Top Platforms
LITSLINK is rated among the top AI and software development companies on top platforms, holding 4.8 on both. Most of our defect detection in manufacturing work starts the same way, with a week of footage and an argument about tolerances.
Have an AI Detecting Project in Mind?
Comparing defect detection solutions for manufacturing, or still working out whether computer vision fits your line at all? Tell us what you produce and what you inspect for. We come back inside 48 hours with a scope and a number.
Thank you for your message. It has been sent.