





Building AI-Powered Lead Scoring Software for Sales Teams
- 85% accuracy on the holdout test set for classifying inbound leads
- ~9 hrs/week returned to each rep on manual qualification
- <400 ms to score a lead at p95, from form submit to CRM field
- 3.5M behavioral events processed every month
Sales teams at B2B software companies rarely lose deals for want of volume. They lose them by working the wrong records first. We built lead-scoring software that reads every inbound signup, weighs fit and intent in a single pass, and pushes the best leads to a rep while the prospect is still on the site.
Project Details
A B2B software client came to us with a manual lead qualification process and a CRM nobody trusted. Lead data sat in three systems that disagreed with each other, and a small SDR team worked a queue of roughly 14,000 monthly inbound records in the order they arrived. What they wanted was a lead scoring model they could explain in one sentence: which conversation should a rep have next?


Business Challenge: Creating an Intelligent Lead Scoring System for B2B Sales Teams
The marketing team was good at lead capture. Nine channels fed the funnel, from paid search and gated reports to webinars, review sites, the docs portal and four partner sources, and together those marketing campaigns produced around 14,000 new records a month. Lead generation was never the bottleneck here.
Qualification stayed manual. An SDR opened a record, checked the company on LinkedIn, guessed at the job title, skimmed whatever the marketing automation platform had logged, then had to assign points from a spreadsheet rubric written two years earlier. Five to seven minutes per lead. Eleven hours a week per rep. Median time to first touch sat at 26 hours, weekend arrivals waited until Tuesday, and their sales processes had grown around the queue rather than around lead quality. Sales and marketing teams argued about that quality in every Monday review, and neither side had numbers to settle it.

Predictive Lead Qualification Accuracy
The old rubric scored a VP at a 12-person startup the same as a VP at a 4,000-seat enterprise. Only about 22% of booked demos came from leads it ranked top tier, so accurate lead scoring was out of reach and reps stopped trusting the number.

Real-Time Score Updates Across Channels
Scores were recalculated nightly. A prospect could read the pricing page, download a comparison guide, and start a trial before anyone noticed, because lead engagement signals reached the CRM the next morning at best.

Multi-Tenant Scoring Architecture
Twelve regional sales teams wanted their own scoring criteria. One shared model with one shared threshold could not serve a US enterprise team and an EMEA mid-market team at once, and nobody wanted a separate fork per region.
Technologies Behind the Predictive Lead Scoring Platform


Our AI Lead Scoring Software Solution
One question shaped the architecture: what does a rep need to see in the four seconds before deciding to call? Not a probability. A number, a band, and a reason. Everything we built pointed toward one goal: improving lead qualification without adding a step to anyone’s day.
Fit and intent lived apart. Firmographic detail (company size, industry, tech stack, job title) sat in the CRM. Behavioral signals such as page views, form fills, doc downloads, email replies and session recency sat in product analytics and in the marketing automation platform. Neither system could see the other, so neither could answer whether an interested visitor was also a plausible buyer. Sales and marketing teams were each reading half a record.
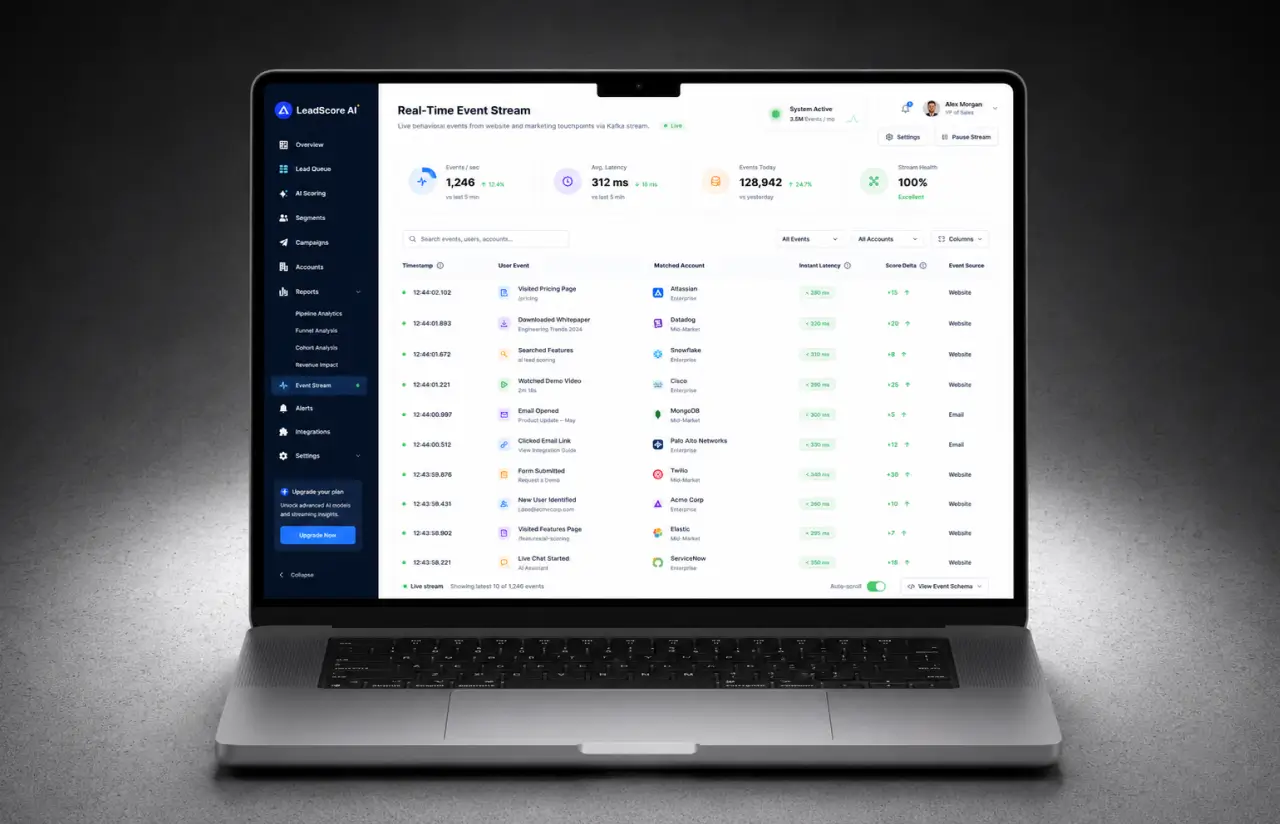
We built the pipeline on Apache Kafka. Every tracked event lands on a topic within a second of firing, Redis holds the rolling engagement counters, and PostgreSQL keeps each scored record with its full history. Around 3.5 million events flow through it monthly.
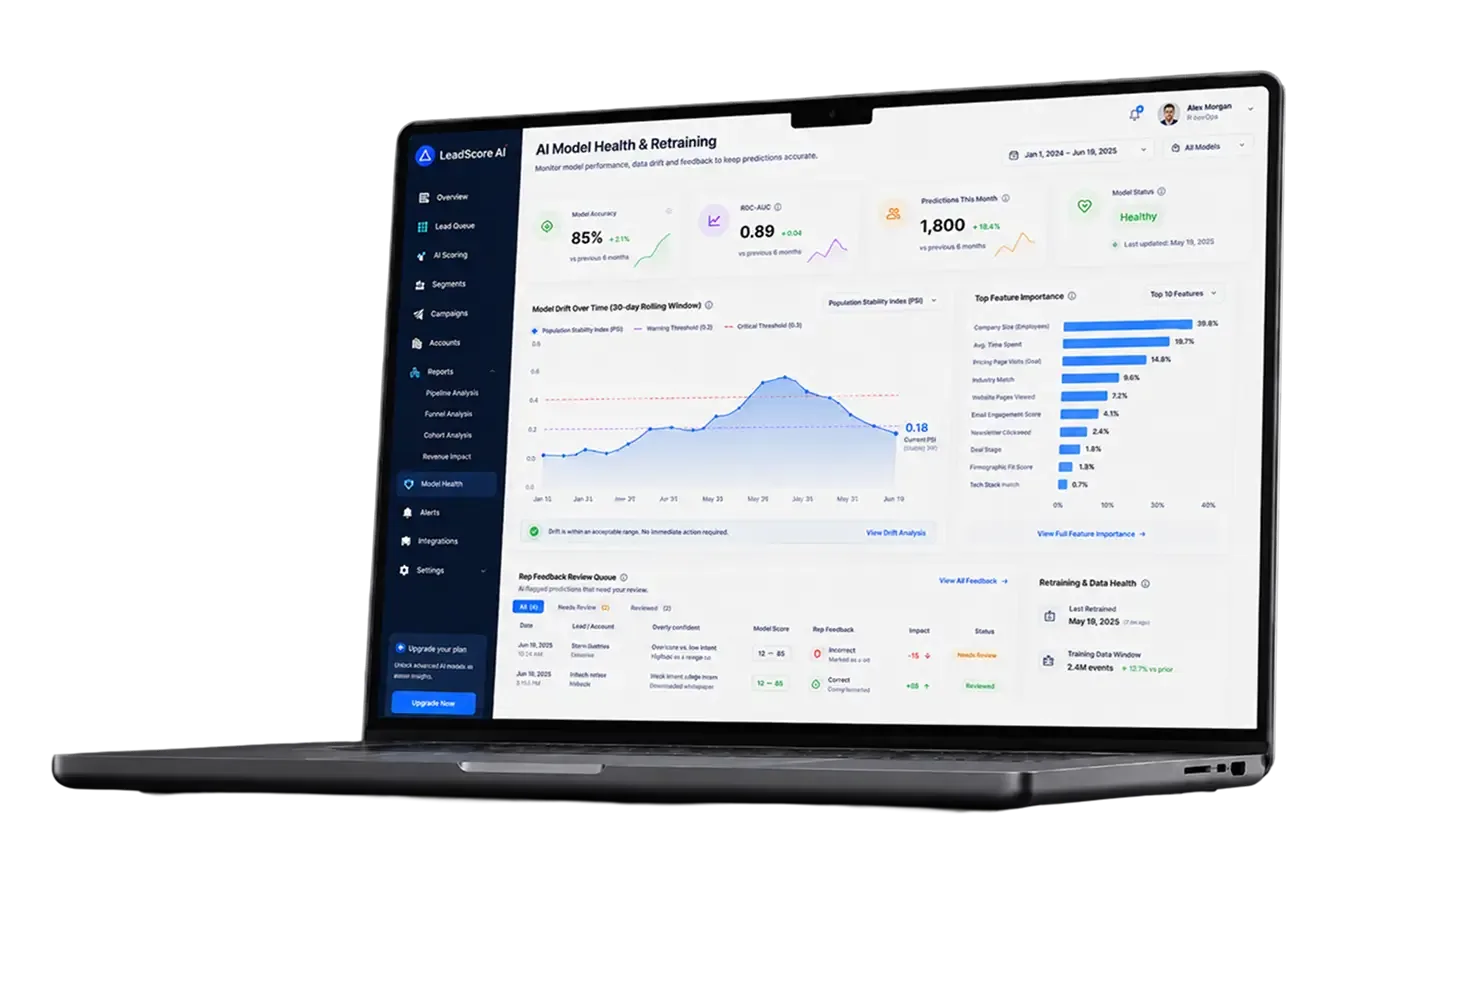
Two models, one score. A gradient-boosted classifier handles fit using roughly 120 data points drawn from historical data on 640,000 past leads, while a separate model reads intent data from the last 30 days of behavior. A calibration layer merges both into a 0 to 100 score range mapped to five bands, A through E. These are scoring models based on the client’s own data rather than a vendor benchmark, and the fit model reached 85% accuracy on the holdout test set with 0.89 AUC.
The client did not want a black box. Most scoring tools hide the math behind a single number, so every score here ships with its top three contributing features in plain language: a rep reads “pricing page, 4 visits this week” instead of “feature_37: 0.211”. Sales leadership can move band thresholds per region without a redeploy, and that one decision made the rollout to twelve teams possible. The lead scoring features below are the ones reps open every day.
AI-Powered Lead Scoring Engine
Two predictive models, fit and intent, combine into one 0 to 100 score with five bands. Automated lead scoring runs on every new record, and weekly retraining on a rolling 18-month window keeps the scoring logic tracking the market instead of last year's ICP.
Real-Time Behavioral Tracking
Kafka streams every page view, form submit, and email reply. Scores refresh in under 400 ms at p95, which means a rep watches intent move while the prospect is still reading the pricing page.
Composite Scoring Models
Demographic lead scoring and behavioral lead scoring run as separate models, then merge. A junior analyst browsing hard and a CFO who visited once land in different bands instead of averaging into the same lukewarm number.
Intelligent Lead Recommendations
The dashboard ranks today's queue and names the top three reasons behind each score. Reps open a short list of the most promising leads each morning, not 400 rows sorted by submission time.
Multi-Channel Integration Dashboard
CRM and marketing tools (Salesforce, HubSpot and six marketing automation platforms) sync through one REST API. Rules can route high-scoring leads to an owner automatically, and CRM scoring fields update in place so nobody leaves Salesforce to check a band.
Enterprise Sales Pipeline Analytics
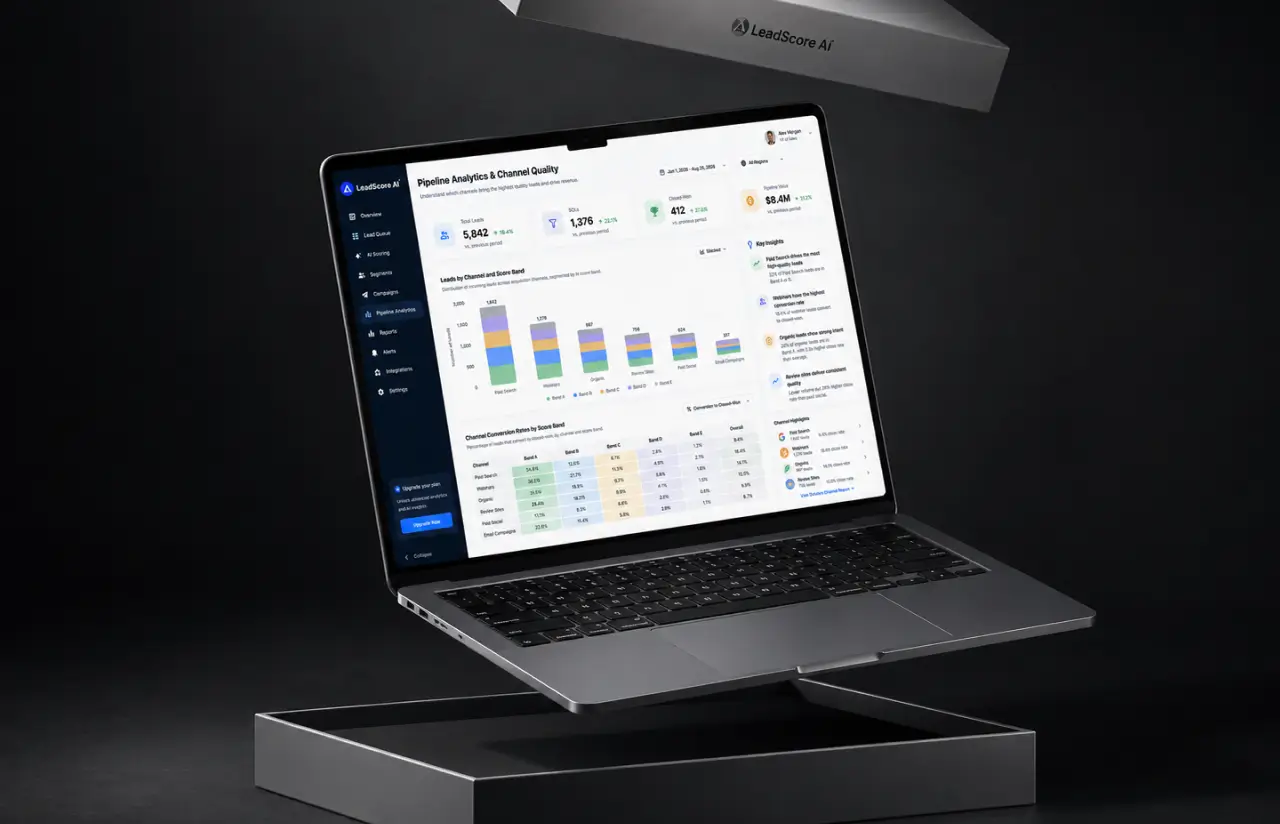
Score history, band conversion rates, and channel quality sit in one view. Marketing teams finally see which marketing efforts produce qualified leads, and which channels the best leads actually come from.
Data Privacy by Design
Scoring runs on the client's own data. Personal fields are hashed before they reach the feature store, retention is capped at 24 months, and every score keeps an audit trail for GDPR and CCPA requests.
Agile Development Methodology
Project Journey
The 18-month project ran in two-week sprints, beginning with three sprints to clean and reconcile 640,000 records across four exports and two inconsistent systems. Before development, discovery defined the lead-scoring criteria, including fit, intent, behavioral relevance, and handling leads with missing CRM data.
How we delivered this lead scoring project
Every sprint opened with a data review and closed with a demo against live traffic, never against fixtures. Two ML engineers owned model work, two backend engineers owned the pipeline and the API, and a QA specialist ran the scoring regression suite, which grew to 340 test cases by launch. Sprint 14 is the one nobody forgot. A Kafka consumer lag spike pushed scores 11 minutes behind live behavior, and fixing it changed how we partitioned topics for the rest of the project.
- We define the project goal together, agree on priority features, and set a realistic delivery date and budget.
- We build a ranked list of everything the product needs, starting with what matters most to the business.
- Work is broken into 2-week cycles. At the start of each, we select the next set of features to deliver.
- The team builds, tests, and integrates features throughout the sprint.
- At the end of every sprint, you see working software and give feedback that shapes the next cycle.
- Each sprint produces a shippable piece of the product. We review what worked, adjust, and move forward.
Development Process Flow
AI development rarely benefits from big-bang releases. A model that looks strong offline can rank real traffic badly, and the only way to find out is to put scores in front of reps early. The two-week cadence meant sales leadership reviewed live output 36 times before the platform reached all twelve teams, and three of those reviews changed the lead scoring logic outright.
How the Predictive Lead Scoring Software Works
- A submission from one of the lead forms, a chat handoff or a trial signup lands on a Kafka topic within a second.
- The record is matched to a company, then firmographic fields are filled from CRM data and third-party sources.
- The fit model can score leads based on about 120 features: headcount, industry, tech stack, job title, region and account history.
- A second model reads 30 days of behavioral data, from pricing views and doc downloads to webinar attendance and email replies.
- Both outputs are calibrated into a single 0 to 100 score and mapped to a band from A down to E.
- A-band records route to an owner with reasons attached, so sales reps see why before they dial. The rest stay in nurture.
UI/UX Design: Intuitive Interface for Sales Team Adoption
Adoption was the real risk here. AI scoring earns trust only when a rep can see the reason behind the number, and a scoring platform that reps ignore is an expensive spreadsheet.
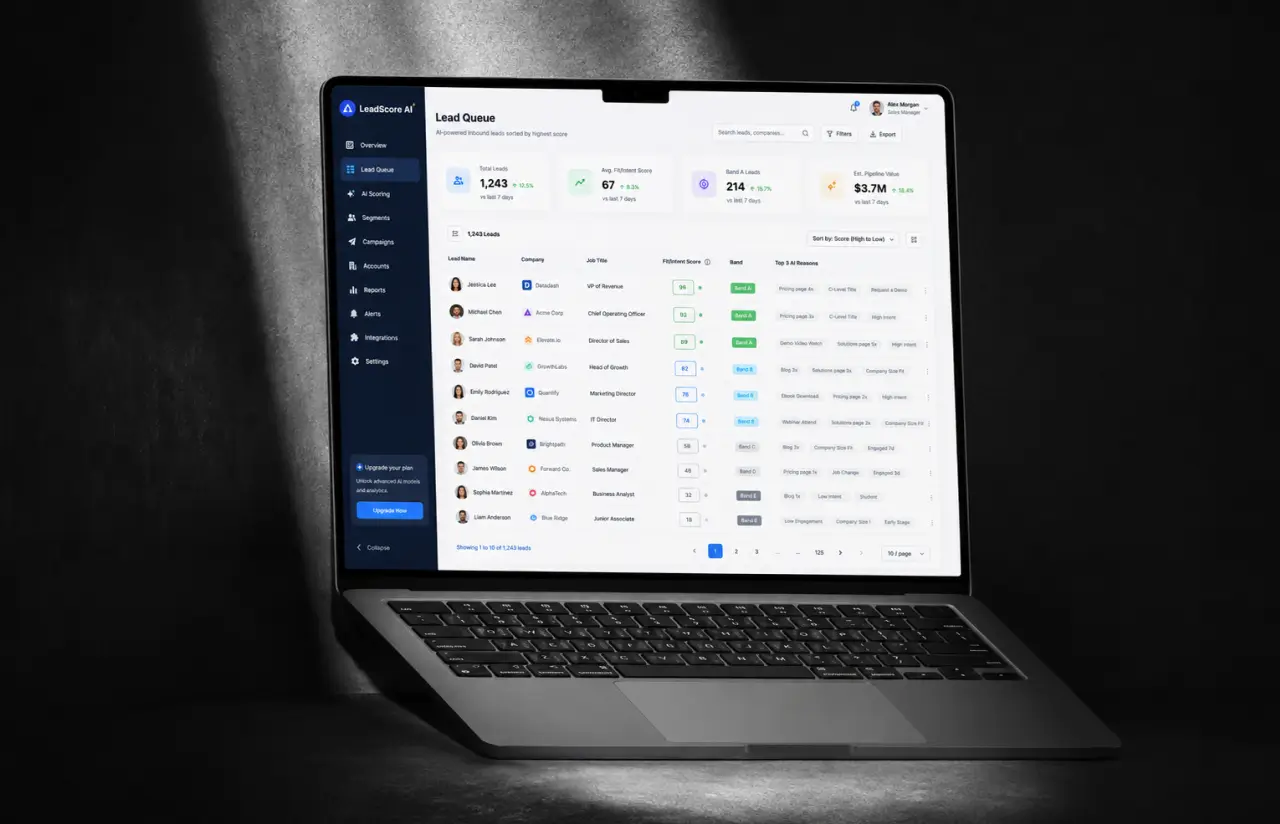
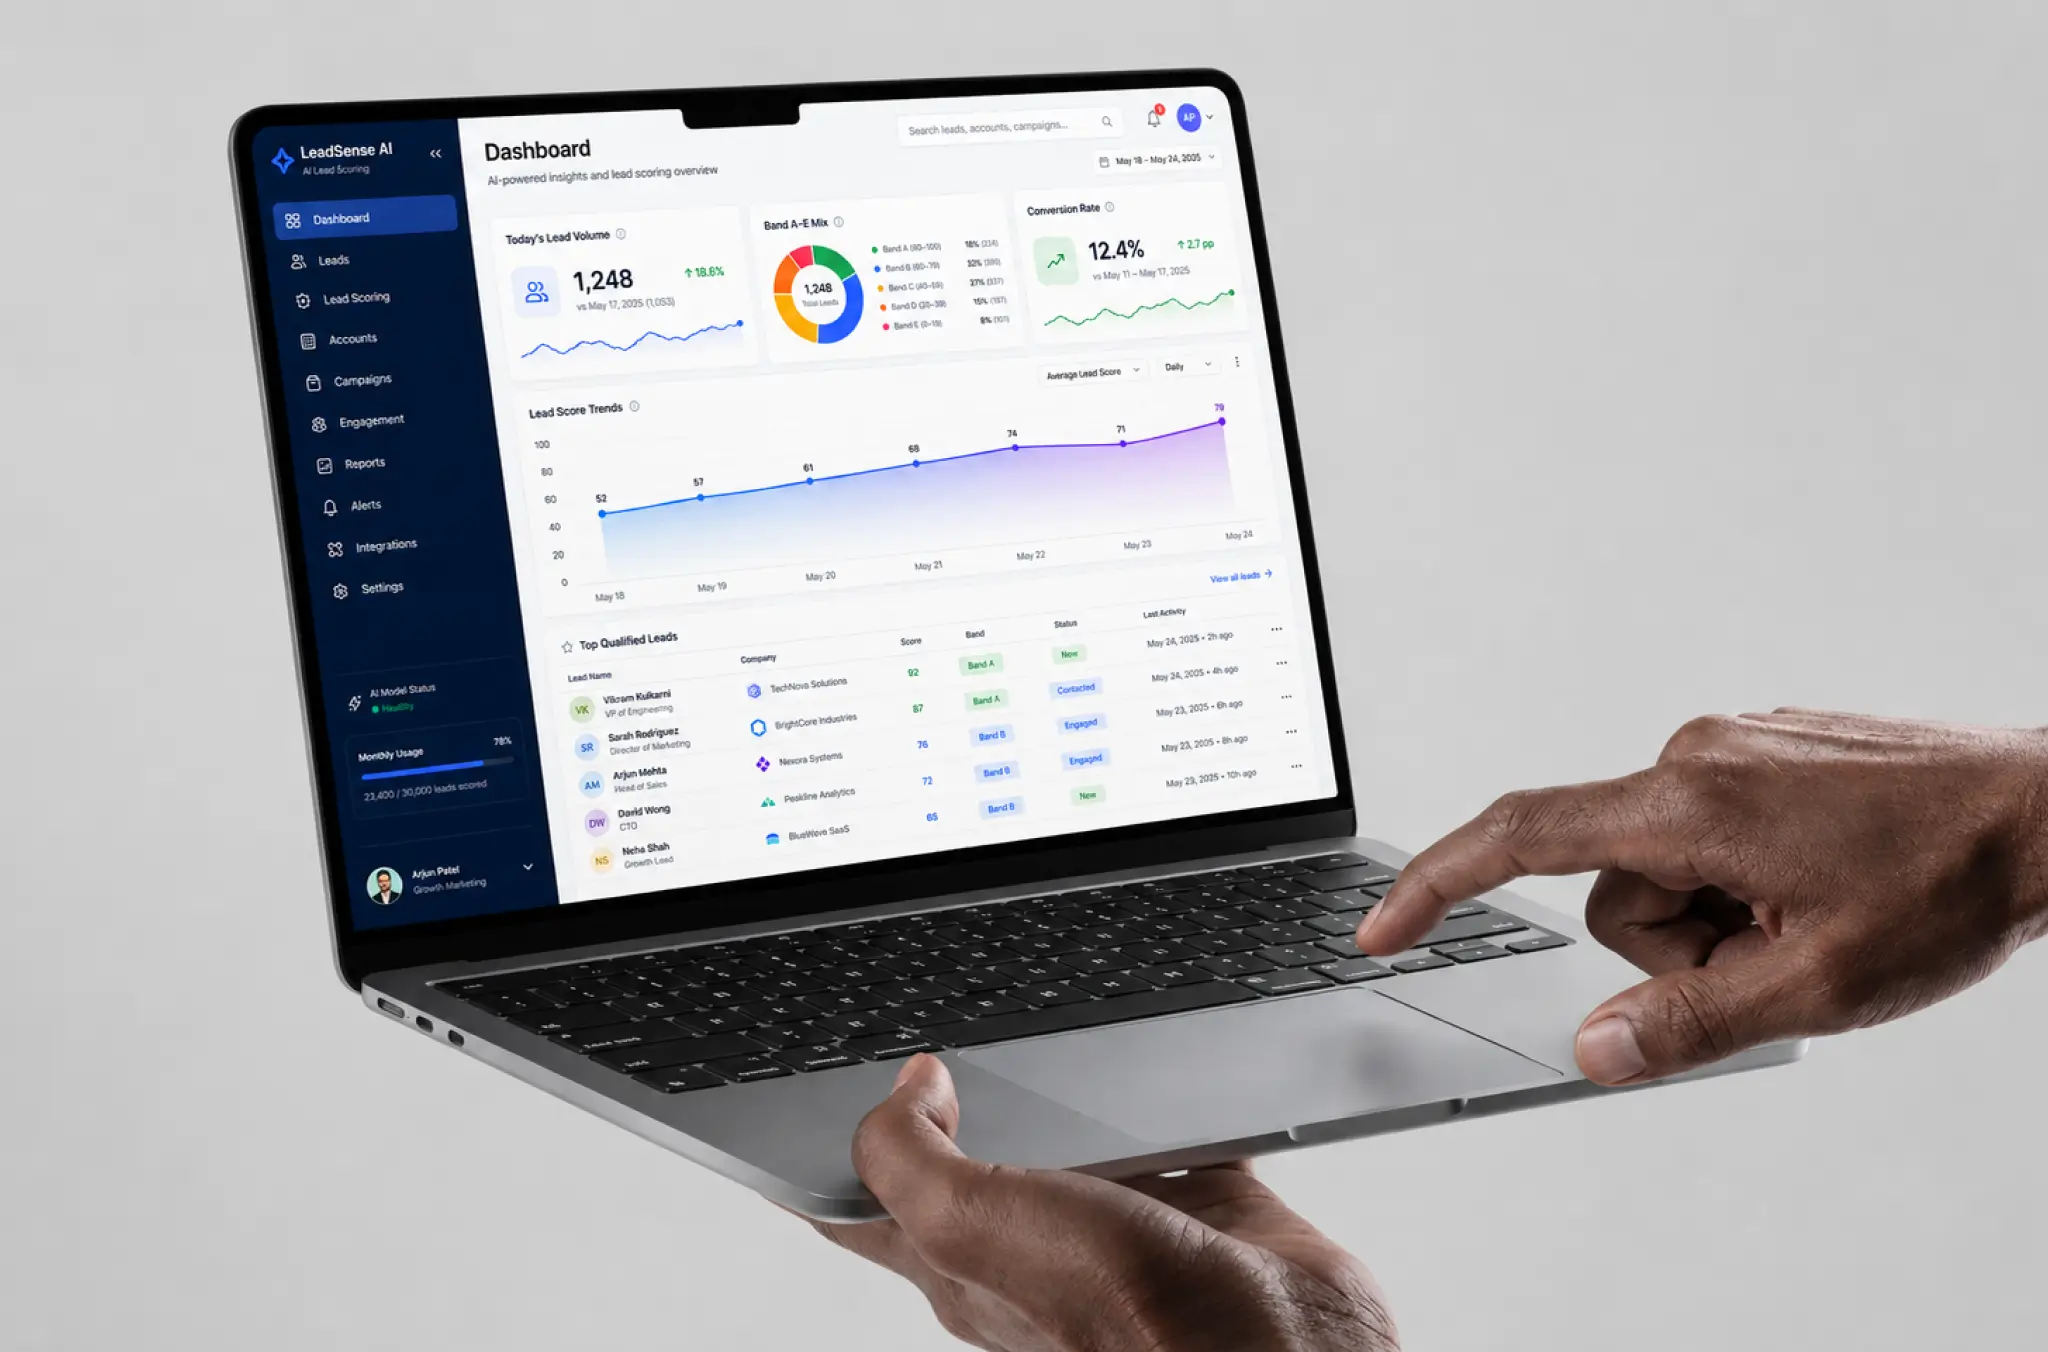
So we shadowed six SDRs for a week before drawing a single screen. They did not read dashboards. They read the first two columns of whatever list was open, then picked up the phone. The queue view leads with name, band, and score, and everything else collapses behind one click. Best leads first, every morning.
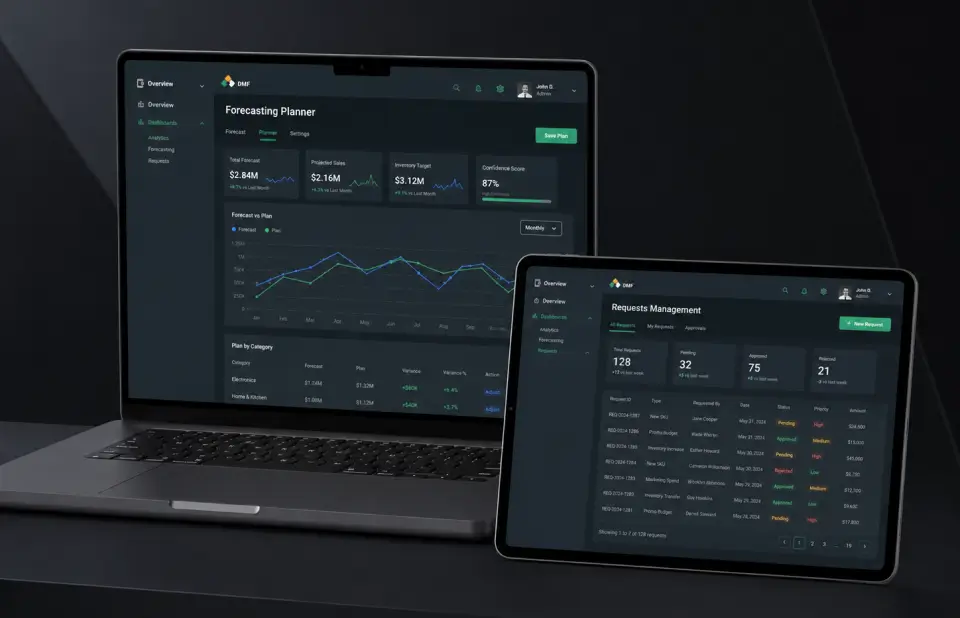
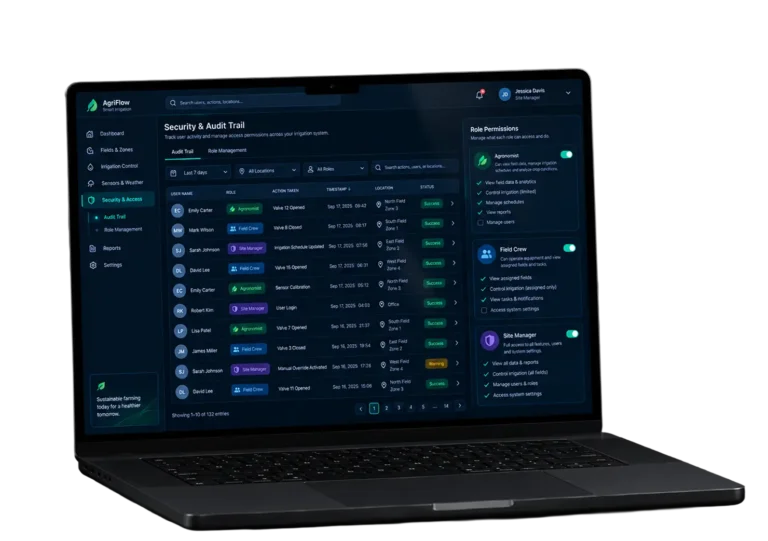
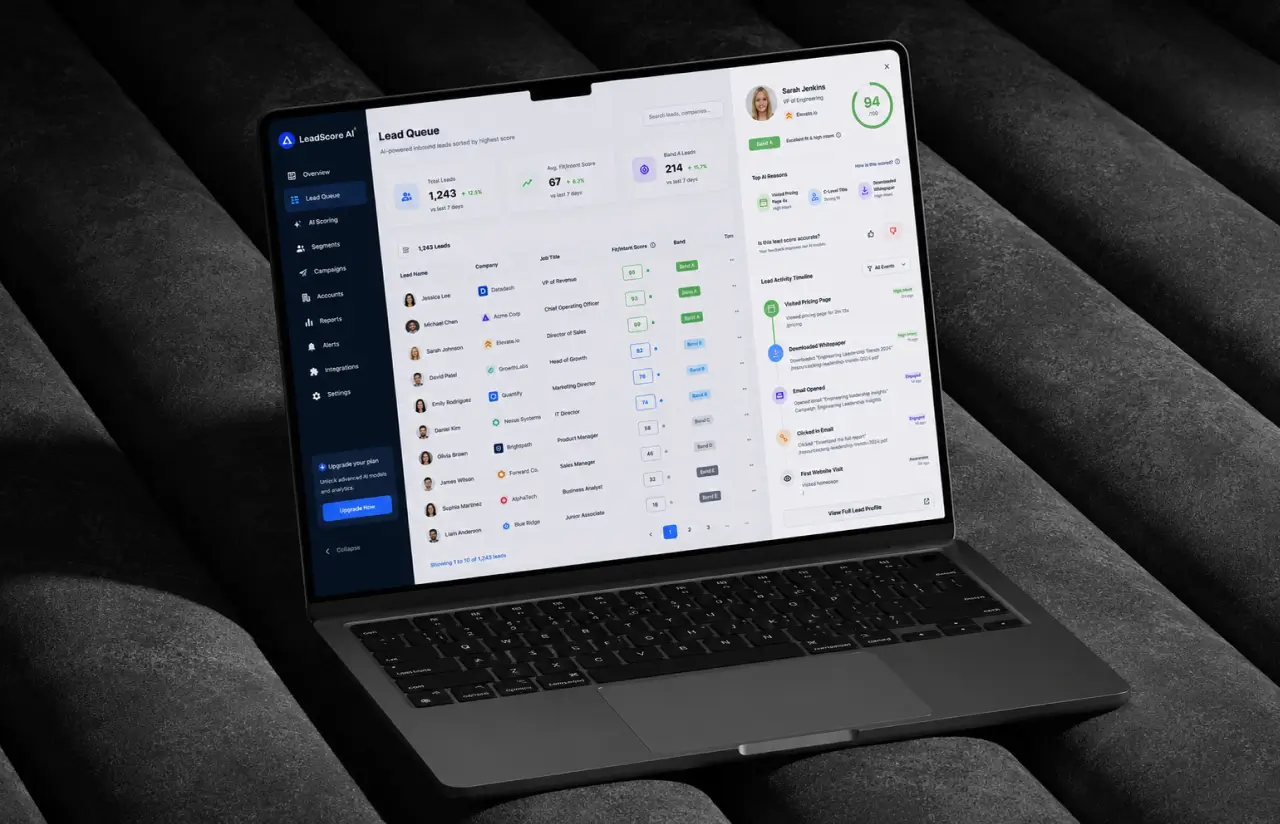
The layout follows a pattern the team already knew: a slim left rail for navigation, three summary cards across the top for today’s volume, band mix and conversion, then a full-width trend chart underneath. Each lead opens as a card rather than a report. Score at the top, three reason chips below it, then a behavior timeline with the newest event first.
Reps can disagree with a score. The thumbs-down control asks why in one tap, and those answers feed the next retraining round, which is how roughly 1,800 rep corrections ended up in the model during year one. Band labels carry text as well as color, because someone raised colorblindness in week two and it never became a support ticket.
Timeline
Five phases, clearly defined
Discovery & Data Audit
- Mapping 640k records across CRM, analytics, and email
- Agreeing which fields count as fit and which events count as intent
- Naming the 12 regional teams that need their own thresholds
Model Prototyping
- Benchmarking logistic regression against gradient boosting
- Testing text embeddings on job title and company description
- Setting the 0 to 100 score range and the five band cutoffs
Agile Development (Sprints)
- Building the Kafka pipeline and the Redis counter layer
- Shipping the REST API and Salesforce plus HubSpot sync
- Adding reason codes, overrides and per-team scoring criteria
QA & Testing
- Running 340 regression cases against replayed production traffic
- Load testing at 5x peak volume, roughly 240 events per second
- Auditing hashed fields, retention rules and access logs
Launch & Support
- Rolling out to two pilot teams, then ten more over 9 weeks
- Watching model drift weekly and retraining on a rolling window
- Adding features from rep feedback, still on 2-week sprints
Results
Before
- ✕~14,000 inbound records a month from lead forms and trials, triaged by hand, 5 to 7 minutes each
- ✕Median first response of 26 hours, and weekend arrivals waited until Tuesday
- ✕Lead data split across CRM, marketing automation and product analytics with no single record
- ✕Marketing qualified leads arrived unranked, and only ~22% of demos came from the top tier
- ✕No score history, so nobody could describe what a good lead actually looked like
After
- ✔85% accuracy on the holdout test set, with 0.89 AUC on fit classification
- ✔4 minutes median first touch for A-band records, down from 26 hours
- ✔~9 hours a week returned to every rep, from 11 hours of manual triage to about 2
- ✔~62% of closed-won pipeline from the top two bands, with lead conversion visible per band and per channel
- ✔One dashboard for scores, reasons, history, and lead management across all 12 teams
Impact of Lead Scoring Software After Launch
Verified Reviews
Our Reputation on Top Platforms
LITSLINK holds a 4.8 rating on Clutch and GoodFirms, with Top Developer and Top Company badges on both. Clients writing about our AI and software development work most often mention technical depth in machine learning, steady communication throughout long engagements, and a willingness to challenge a requirement when the data says otherwise.
Have a Lead Scoring Project in Mind?
Need lead scoring software for your sales and marketing teams, or a predictive model that tells reps which accounts to call first? Tell us what you are working with (data sources, CRM, monthly volume) and a LITSLINK specialist gets back to you within 48 hours.
Thank you for your message. It has been sent.