





Creating a Sentiment Analysis Solution Based on Customer Feedback Processing
- 1M+ Amazon reviews in training set
- 0.38 mean absolute error, 1-5 scale
- 94% of scores within one star
- ~35 ms to score one review
- 100% of customer feedback scored
Star ratings tell you a product sits at 4.2. They never tell you why. LITSLINK built a sentiment analysis solution that reads the text of every customer review, predicts a 1-5 score for it, and shows an e-commerce merchandising team which products are slipping before the average product rating moves.
Project Details
A US e-commerce retailer came to us with four review channels, 85,000 SKUs, and no practical way to read the feedback piling up behind them. They wanted every customer product rating and social media mention turned into a sentiment score their merchandising team could sort by.


Business Challenge: Building a Sentiment Analysis Platform for Customer Intelligence
The client sells through their own storefront, two marketplaces, and a mobile app. About 120,000 pieces of customer feedback arrive every month across those four channels. Star ratings covered part of that volume. Support tickets, app comments, and social mentions came in without a product rating, so most of the textual data carried no sentiment score at all, including the mentions that move brand reputation the fastest.
Three analysts did the reading. They sampled around 2,500 reviews a month, tagged them in a shared spreadsheet, and wrote a summary each quarter. A sizing fault on one jacket line took nine weeks to reach the category manager. Returns on that line had already climbed 18% by then, and the online reviews describing the problem had been sitting in an export the whole time.

Real-time sentiment detection at scale
Manual sampling reached 2% of incoming reviews. Negative sentiment took nine days on average to surface, well after the refund window had closed on the first wave of buyers. Nothing ran on the other 98% of customer feedback.

Multi-channel data integration
Four systems, four schemas. Marketplace exports arrived as CSV, the app feed as JSON, and social mentions carried no rating field, so nothing could be compared across channels without a day of manual cleanup.

Actionable business intelligence
Quarterly decks listed themes rather than products. Merchandisers wanted a ranked list of which SKUs to pull and got slides instead, so buying calls ran on instinct rather than on customer sentiment.
Technologies Behind the Solution for Rating Customer Reviews







Our Sentiment Analysis Software Solution
One question shaped every decision here: can a model score a review the way the person who wrote it would have? If the answer is yes, then every piece of unstructured data in the archive turns into a sentiment score, whether or not a star was ever attached to it.
The rating lived on the storefront. The complaint lived in the text, inside a support ticket or a comment nobody exported. Our sentiment analysis model predicts the missing number and puts both halves of the picture in one table, which is where opinion mining stops being an academic exercise and starts being a merchandising tool.
We fine-tuned BERT with a simple regression head on 1,000,000 Amazon product reviews paired with their ratings. Five-class sentiment classification would have forced each review into a bucket, and a 3.6 rounds away into something less useful. Regression keeps the output continuous. Sorting every comment into positive, negative, or neutral would have answered a smaller question than the one the client asked. The dataset split 850,000 for training, 75,000 for validation, and 75,000 held back for a final test nobody touched until the end.
Baseline came first. A rule-based sentiment analysis lexicon paired with TF-IDF and logistic regression gave a mean absolute error of 0.71 stars, which set the bar for the BERT-based review analysis that followed. The fine-tuned model landed at 0.38, roughly 46% less error. Sequence length caps at 256 tokens, enough for about 96% of reviews without truncation. Three epochs, batch size 32, and the full training run finished in under nine hours.
Accurate sentiment analysis on a 1-5 scale is hardest in the middle. Exact-star agreement runs near 82% at the ends of the scale and drops to 58% on 3-star text, where neutral sentiment and mild disappointment use almost the same words. The sentiment expressed in “it’s fine I guess” sits close to 3.2, and no rule set lands that twice in a row. Machine learning techniques that treat this as a five-way choice hide that weakness. Regression exposes it, so the team could see where the model wobbled and weight the training data accordingly.
Nothing about the aspect layer is generic. The 12 categories came out of the client’s own vocabulary, because “runs small” means something precise in apparel and nothing at all in electronics. Two of our data scientists sat with two category managers and hand-labeled the first 4,000 examples before any fine-grained sentiment analysis went near production. Two types of sentiment analysis run side by side in production now: one overall sentiment score per review, and aspect-level scores underneath it.
AI-Powered Emotion Detection
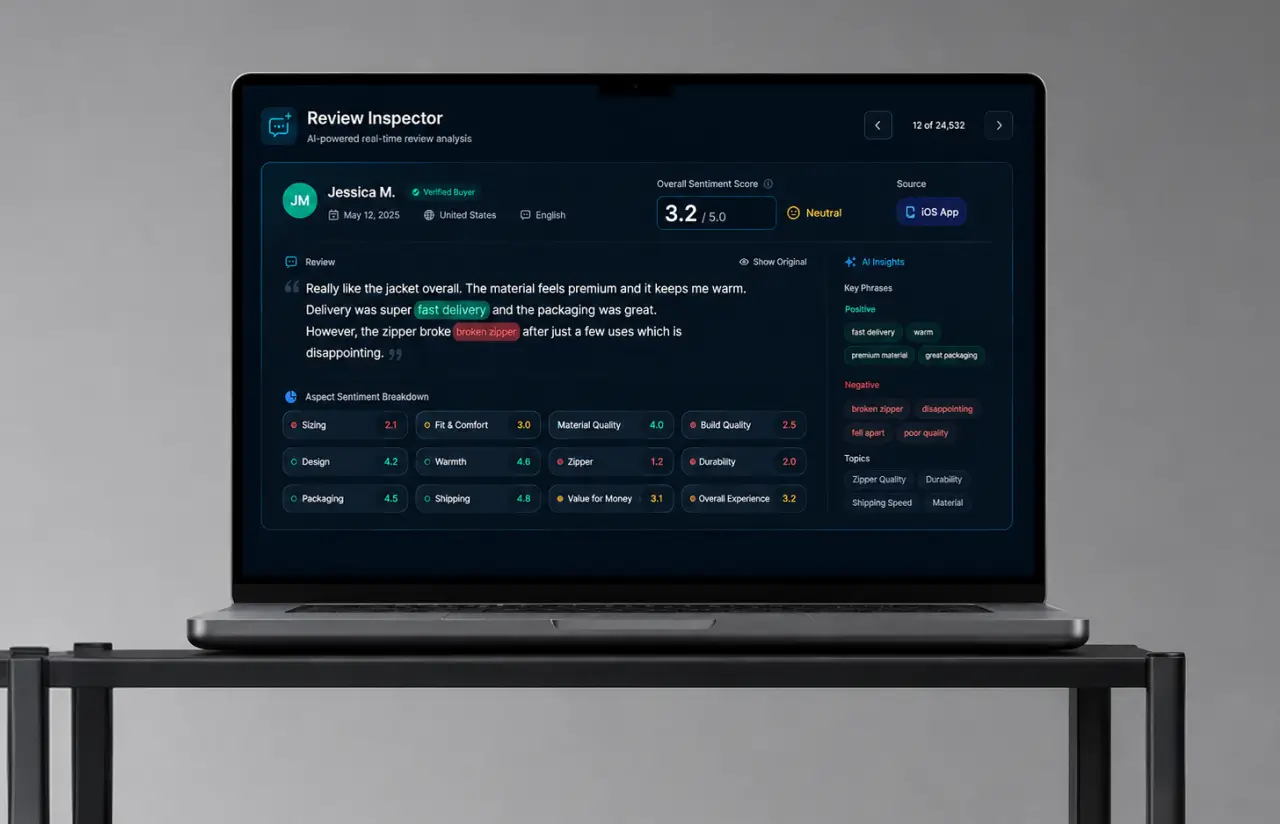
The model reads emotional tone instead of counting positive and negative words. "Great, another broken zipper" scores 1.4 here. The lexicon baseline scored that same sentence 3.9, because it saw "great" and stopped thinking. Emotion analysis here does not label specific emotions such as anger or delight. It places human language on the same 1-5 scale the shopper would have used.
Multi-Language Sentiment Analysis
Six languages at launch: English, Spanish, German, French, Portuguese, Italian. Non-English text routes to a multilingual checkpoint, and accuracy sits about 4 points below English on the same test set. Good enough to rank products, and we told the client where the gap was.
Aspect-Based Customer Review Scoring
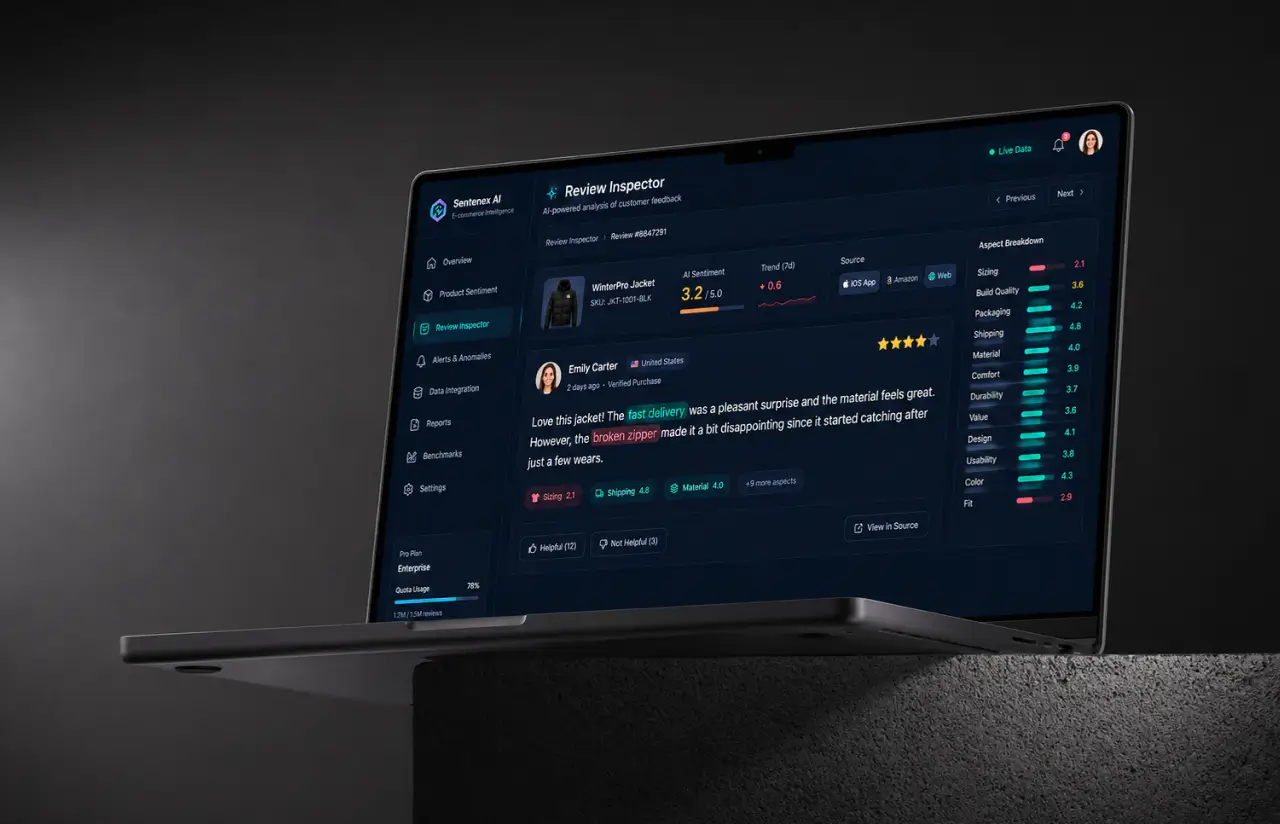
Each review picks up between zero and 12 aspect labels, each carrying its own sentiment score. A 4-star review can hold 2.1 on shipping and 4.8 on build quality, which is the kind of split a single overall sentiment score buries. Positive and negative sentiments sit inside the same review far more often than the star count suggests.
Real-Time Sentiment Monitoring
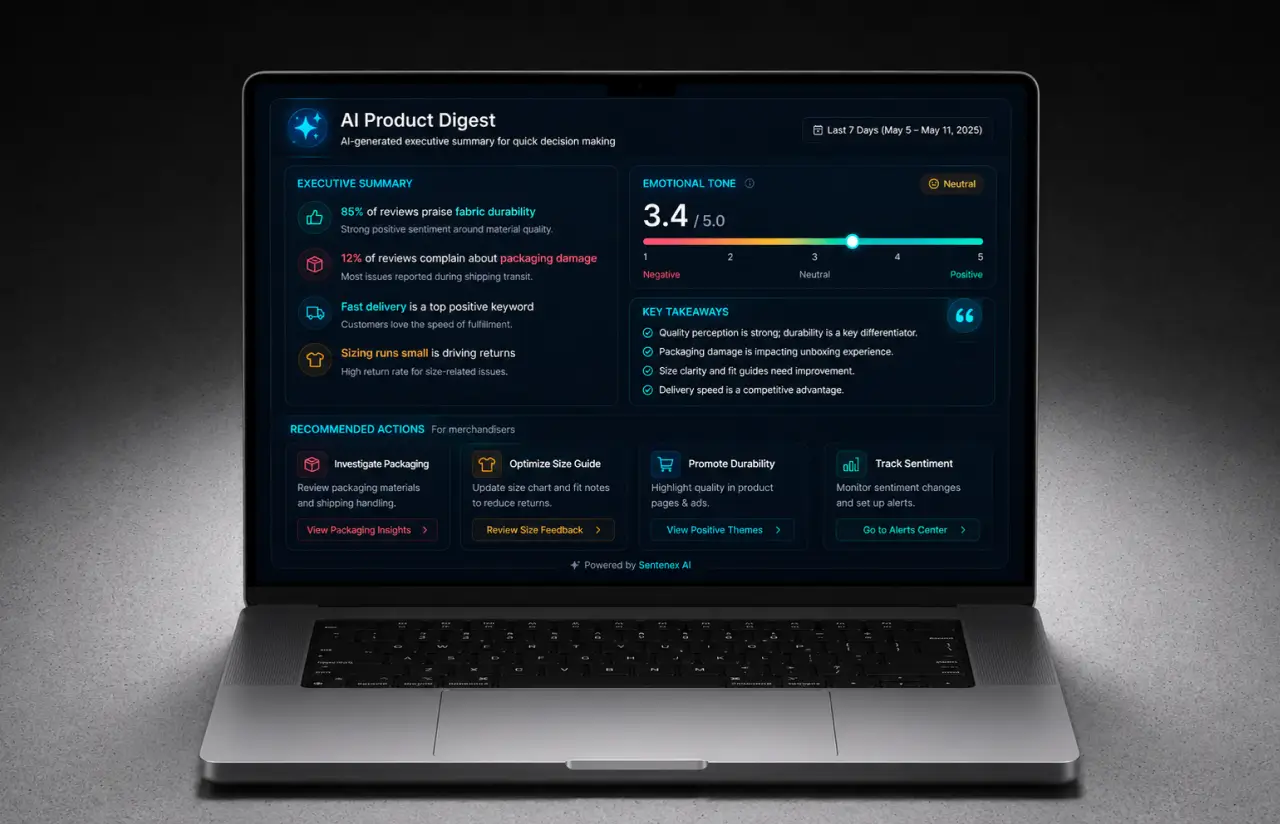
New reviews score within 35 ms of arriving. When a SKU's rolling 7-day score drops more than 0.5, the category owner gets an alert that morning rather than a mention in next quarter's summary.
Unified Sentiment Dashboard
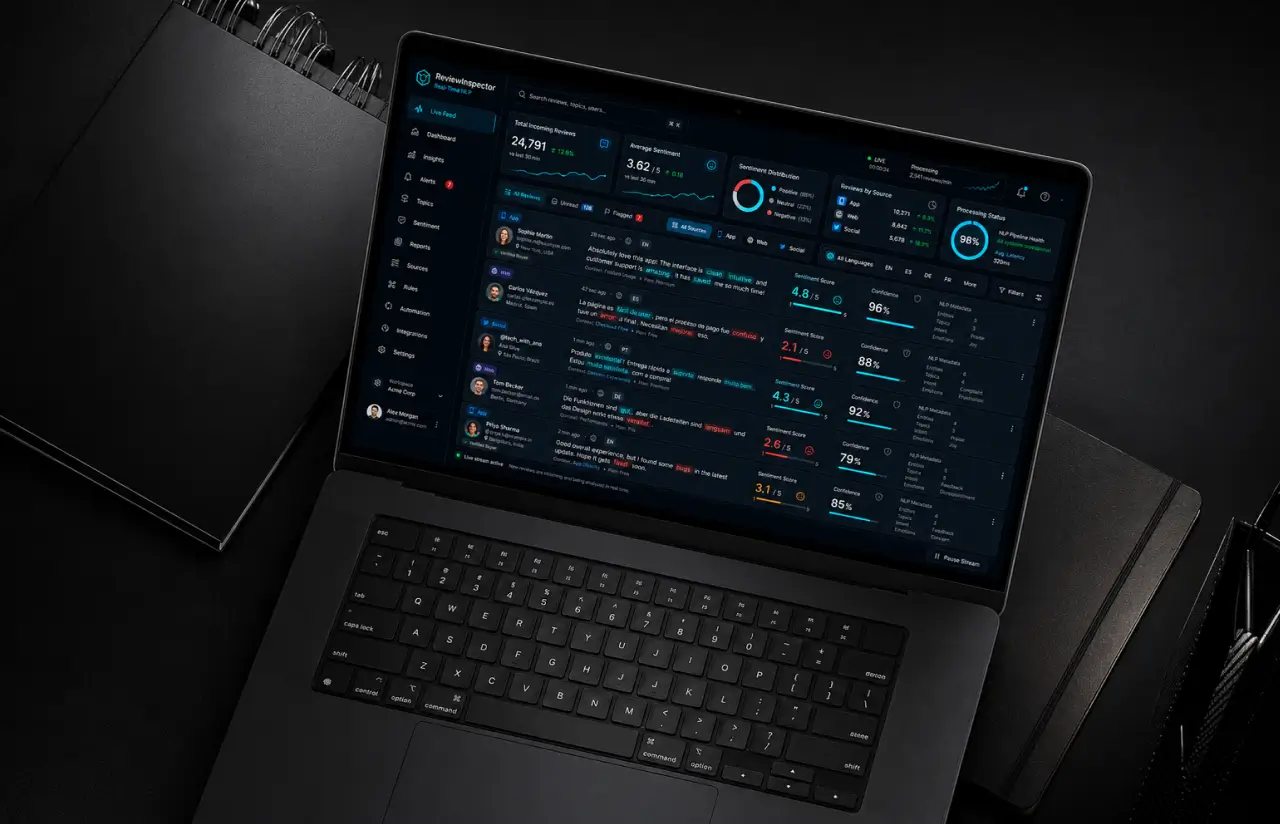
One view across 4.2 million historical reviews. It replaced three spreadsheets and two off-the-shelf sentiment analysis tools that never agreed with each other. Product tables re-rank nightly, and every number in them opens the text data behind it, so nobody has to trust a figure they cannot inspect.
API-First Architecture
A REST endpoint scores one review or a batch of 5,000. Their platform team can perform sentiment analysis on any text field they choose, including search feedback and returned-order notes. p95 latency stays under 300 ms, the number they asked for before agreeing to integrate.
Privacy-Compliant Processing
Names, emails, and order IDs come off at ingestion. The model never sees them. Raw exports are deleted from S3 after 30 days, which kept the client's legal team out of the critical path.
Scrum Methodology
Project Journey
The seven-person team worked across ten two-week sprints. After the first demo struggled with the 8% of reviews containing fewer than four words, the model was refined using four data sources, an aspect taxonomy, and regression-based scoring, with extra sensitivity to costly missed 1-star reviews.
How the Review Rating Prediction Solution Works
- Analysts drop a CSV into the dashboard, or the pipeline pulls from four connected channels every 15 minutes.
- HTML, boilerplate, and duplicate submissions come out. Reviewer names and emails are stripped at this step, before anything is stored.
- The model returns a continuous 1-5 sentiment score plus a confidence value. Around 35 ms per review on a single worker.
- Twelve categories run over the same text, so "fast delivery, terrible packaging" splits into two scores instead of averaging into one flat number.
- Per-SKU averages, 7-day trend, and channel breakdown land in PostgreSQL. Redis serves roughly 60% of dashboard reads.
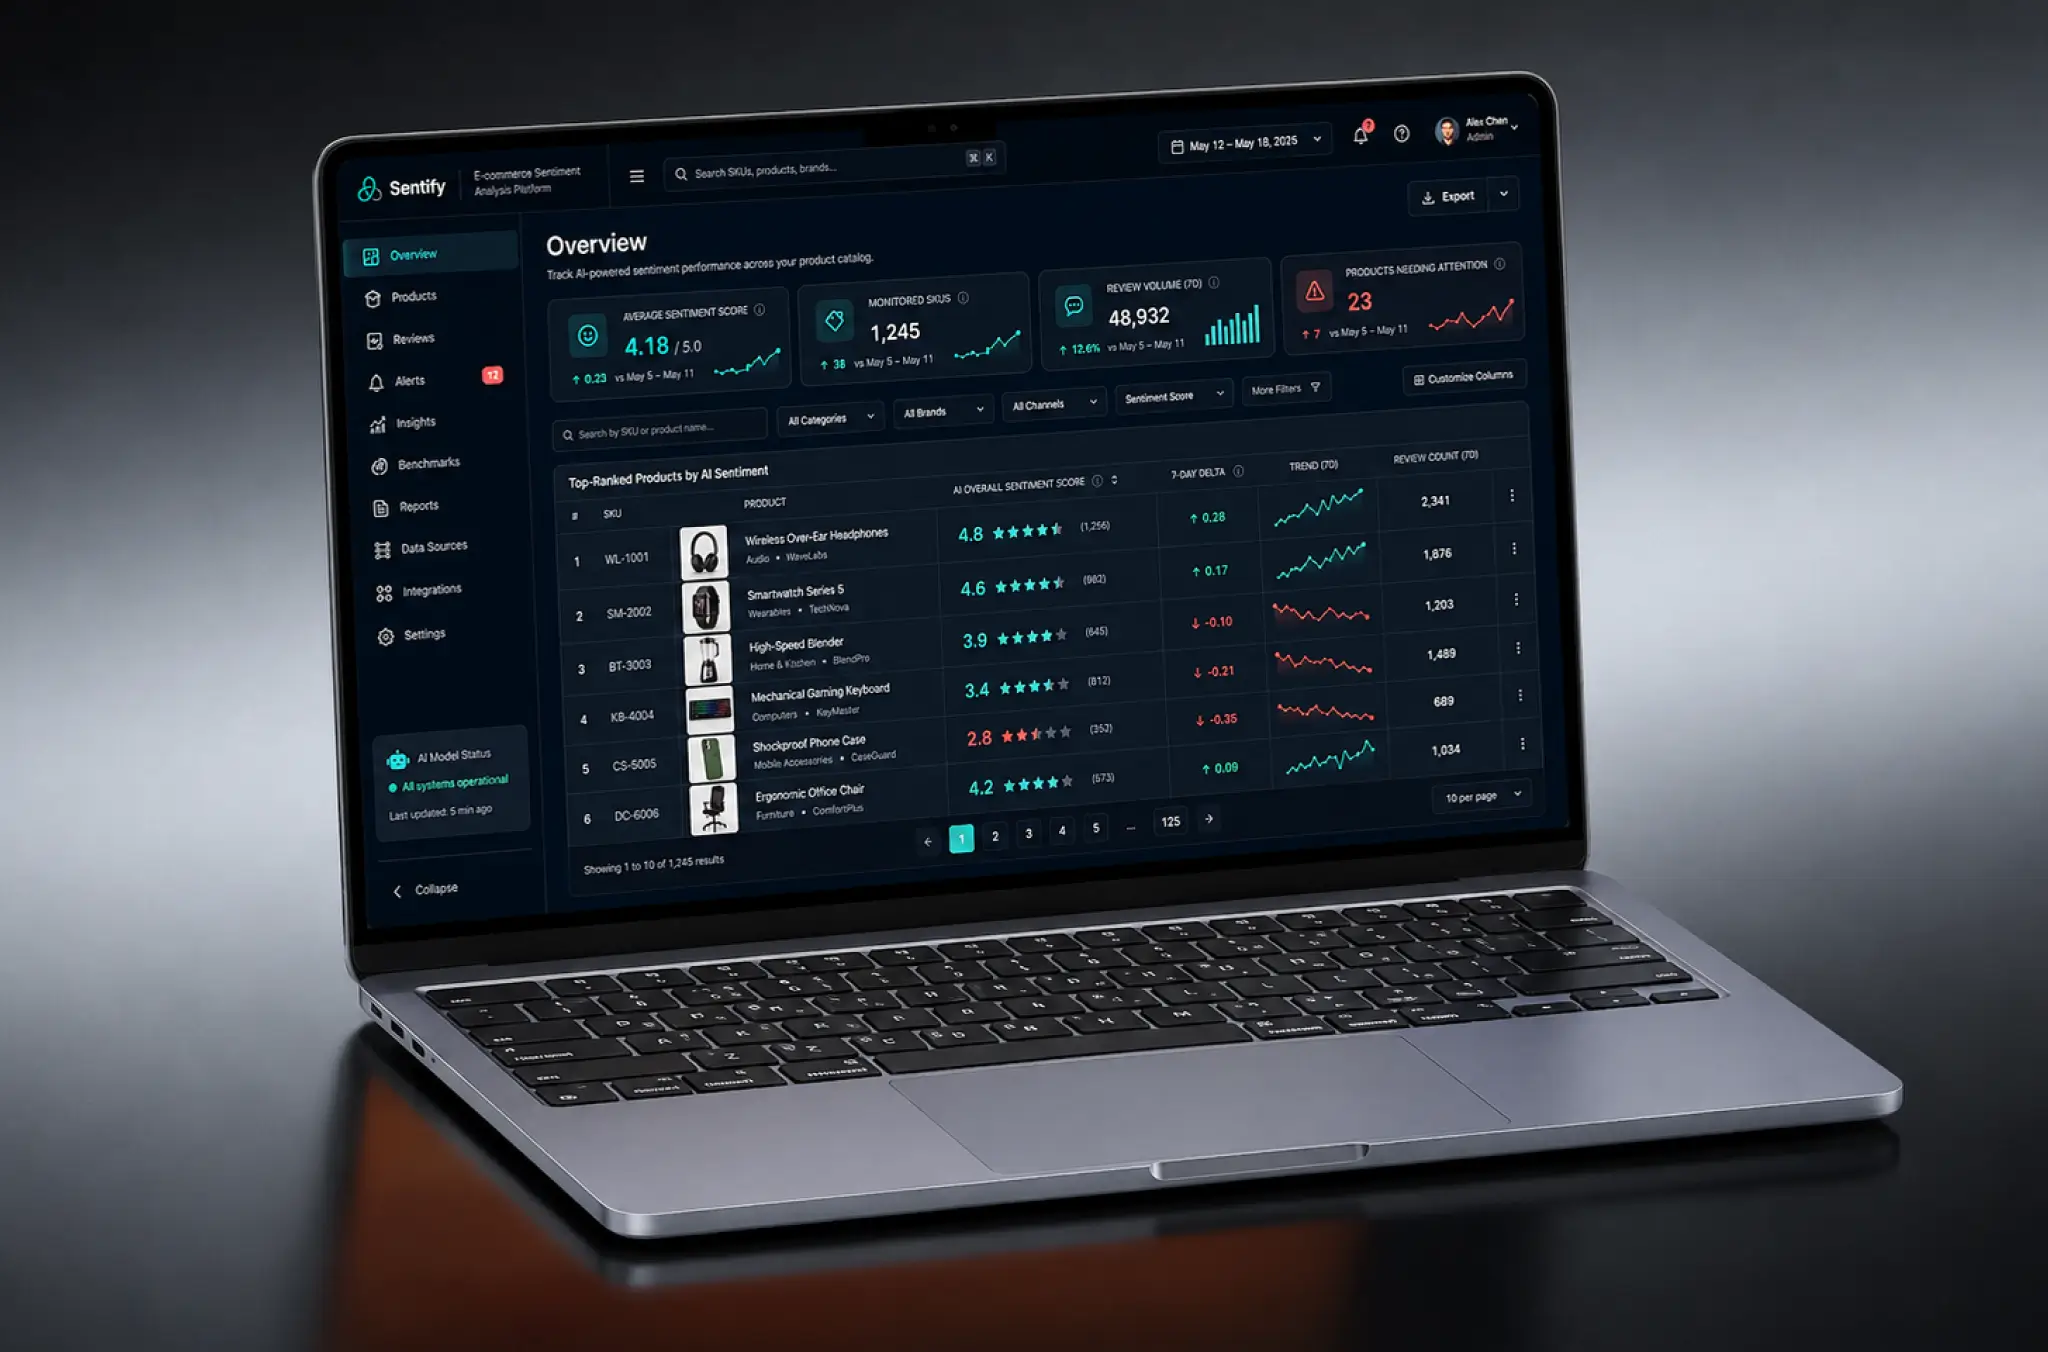
- The dashboard publishes top-performing and lowest-performing product tables, plus alerts wherever negative sentiment spikes overnight.
Scrum Process Flow
Artificial intelligence development does not suit big-bang releases. On a two-week cadence, the client saw the model scoring their own reviews from sprint three onward, and they could argue with the output while changes were still cheap to make.
How We Delivered the Project for Predicting Review Scores
- We define the project goal together, agree on priority features, and set a realistic delivery date and budget.
- We build a ranked list of everything the product needs, starting with what matters most to the business.
- Work is broken into 2-week cycles. At the start of each, we select the next set of features to deliver.
- The team builds, tests, and integrates features throughout the sprint.
- At the end of every sprint, you see working software and give feedback that shapes the next cycle.
- Each sprint produces a shippable piece of the product. We review what worked, adjust, and move forward.
UI/UX Design
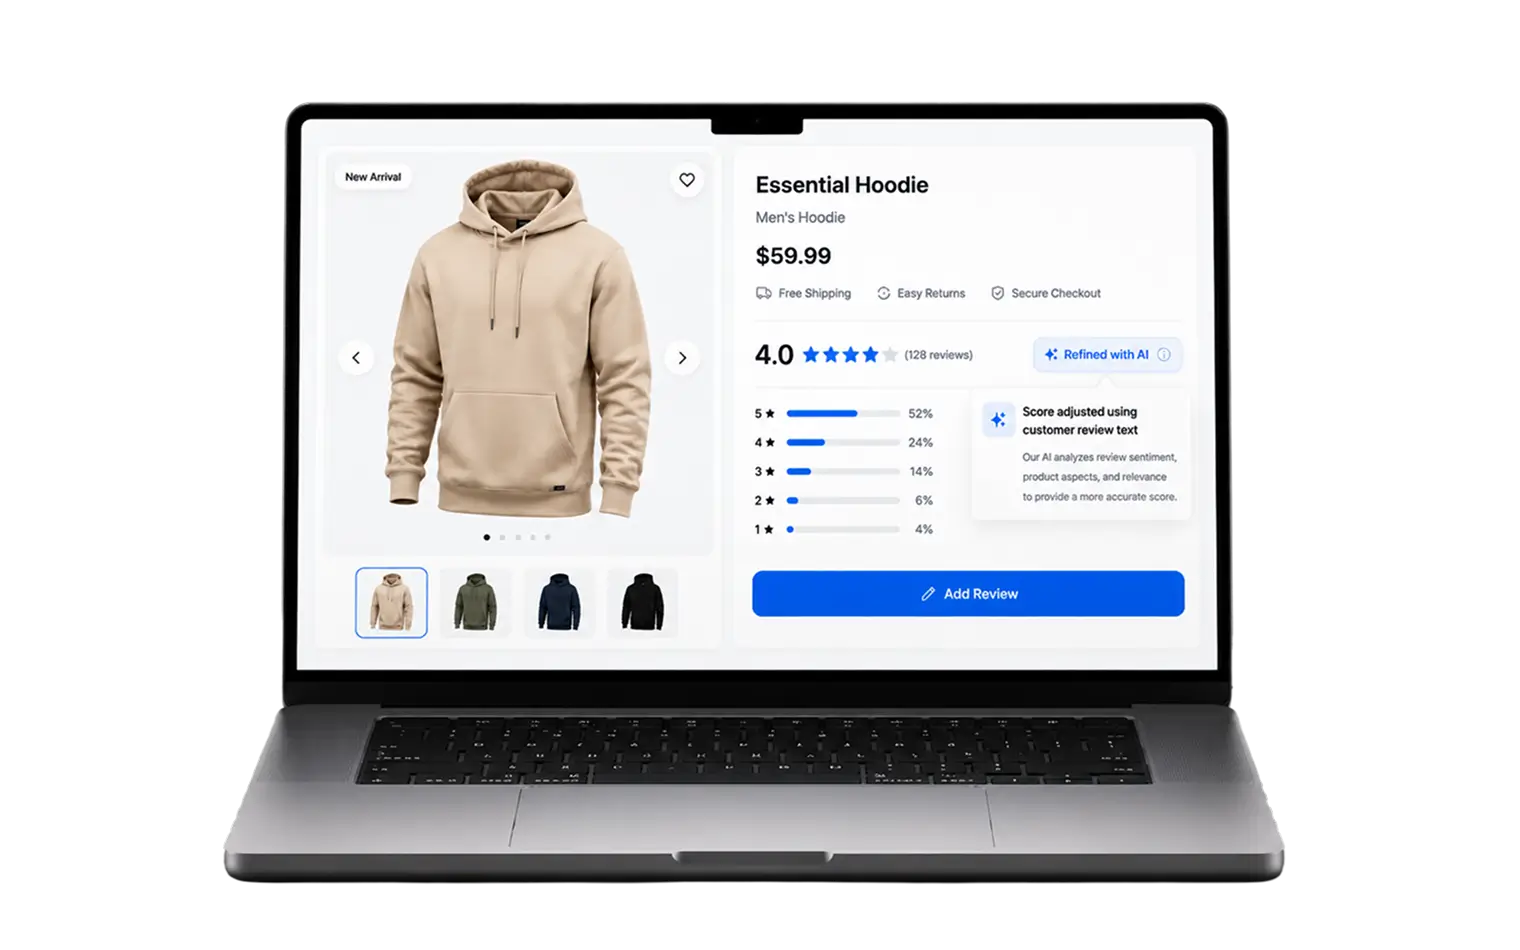
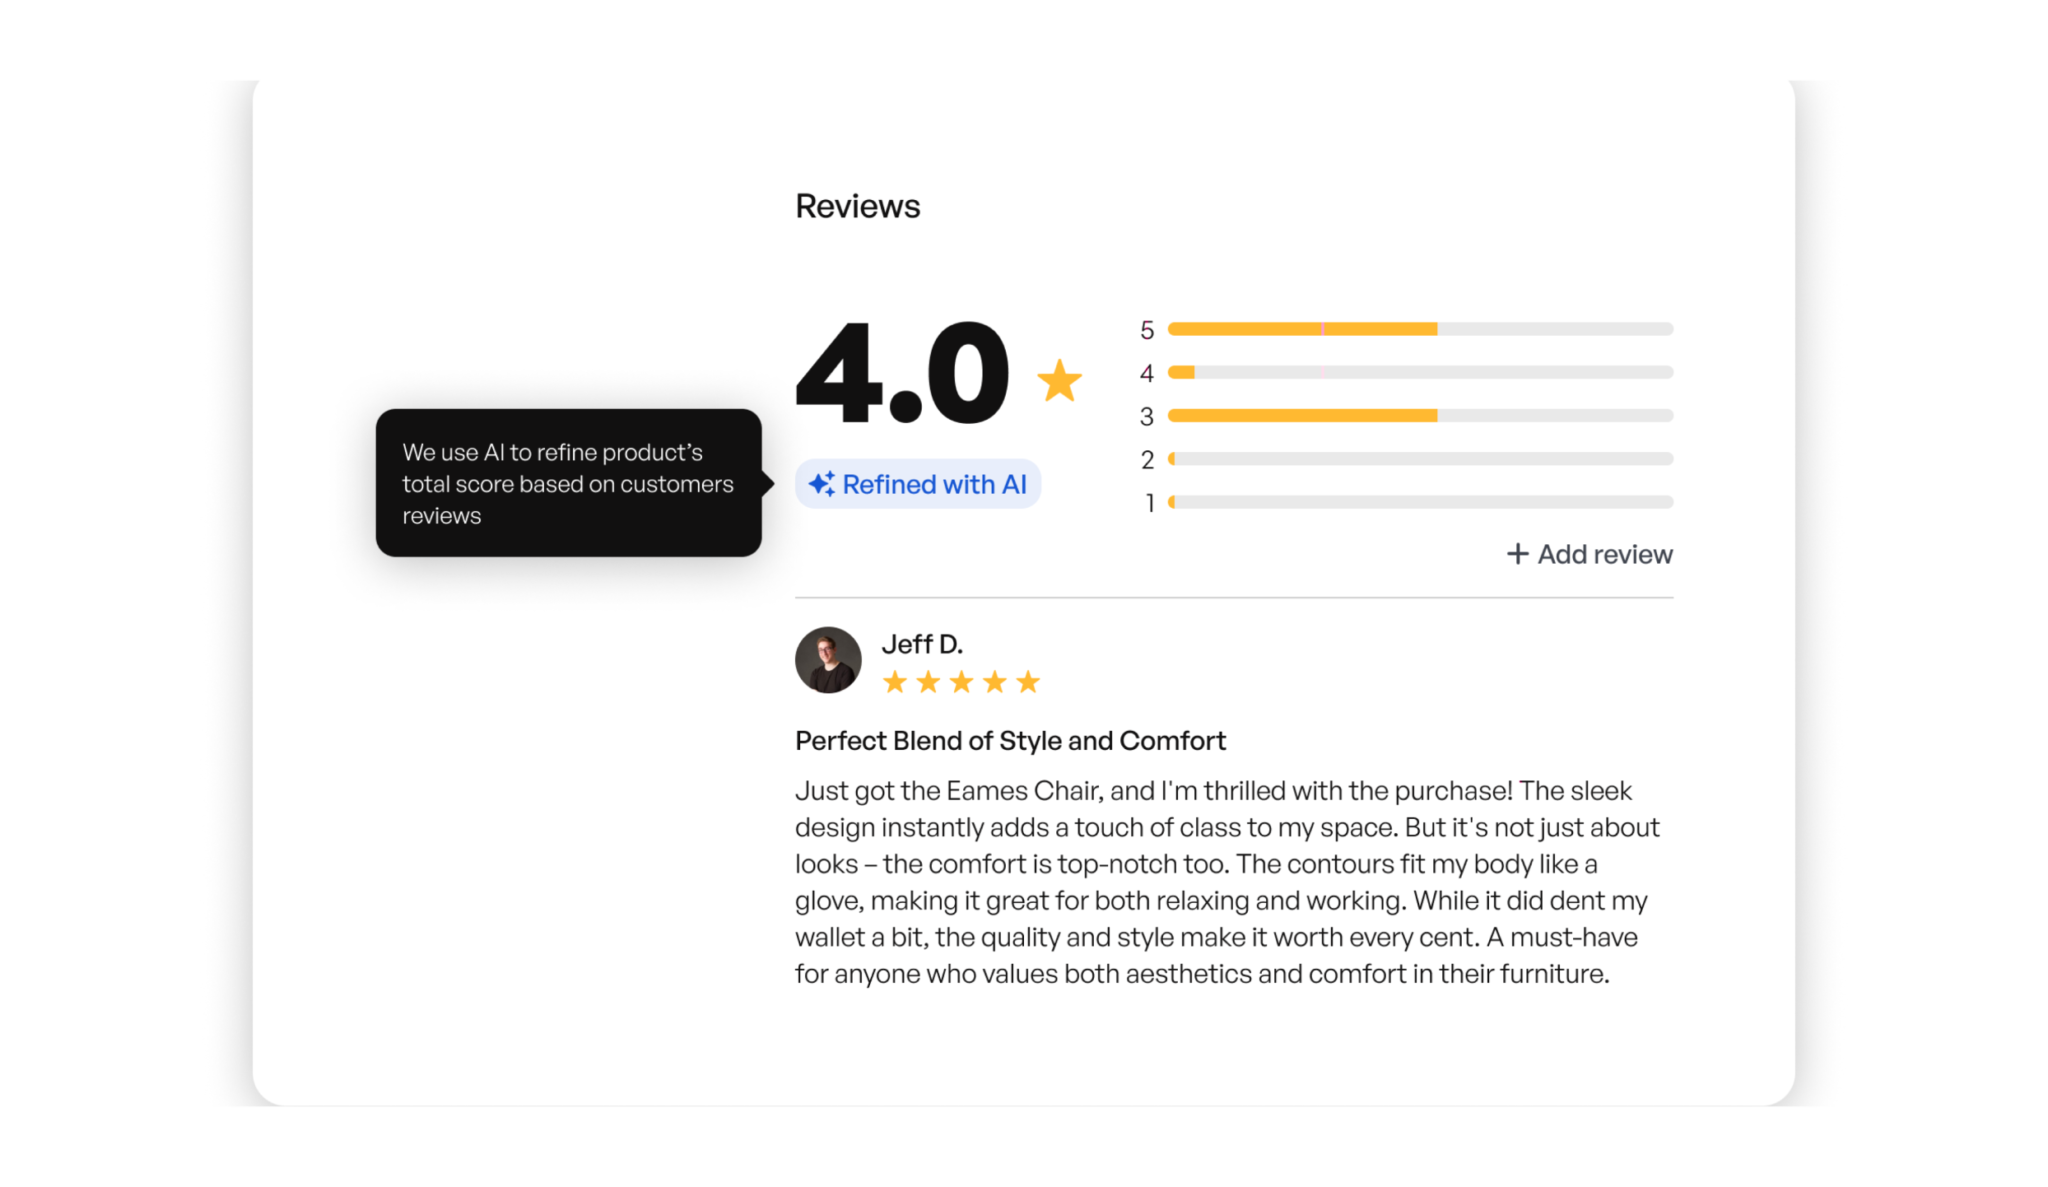
Shoppers distrust a number they cannot account for. The product page shows the refined score at full size, 4.0 with a star beside it, and next to that a small badge reading Refined with AI. Tap the badge and a tooltip explains it in one line: the total score is adjusted using the text of customer reviews rather than the stars alone.
The five-bar distribution sits to the right of the score. A 4.0 built from mostly 5s with a handful of 3s reads very differently from a flat 4.0, and the bars make that visible without a second tap. Add review stays directly beneath them, since the moment someone finishes reading another shopper’s opinion is the moment they are most likely to write their own.
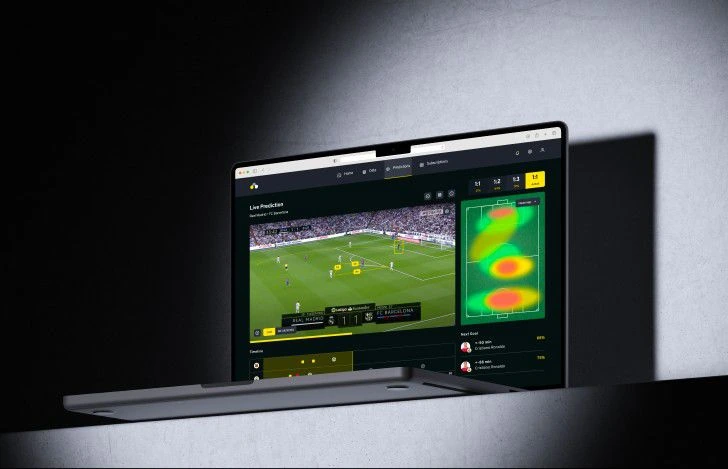
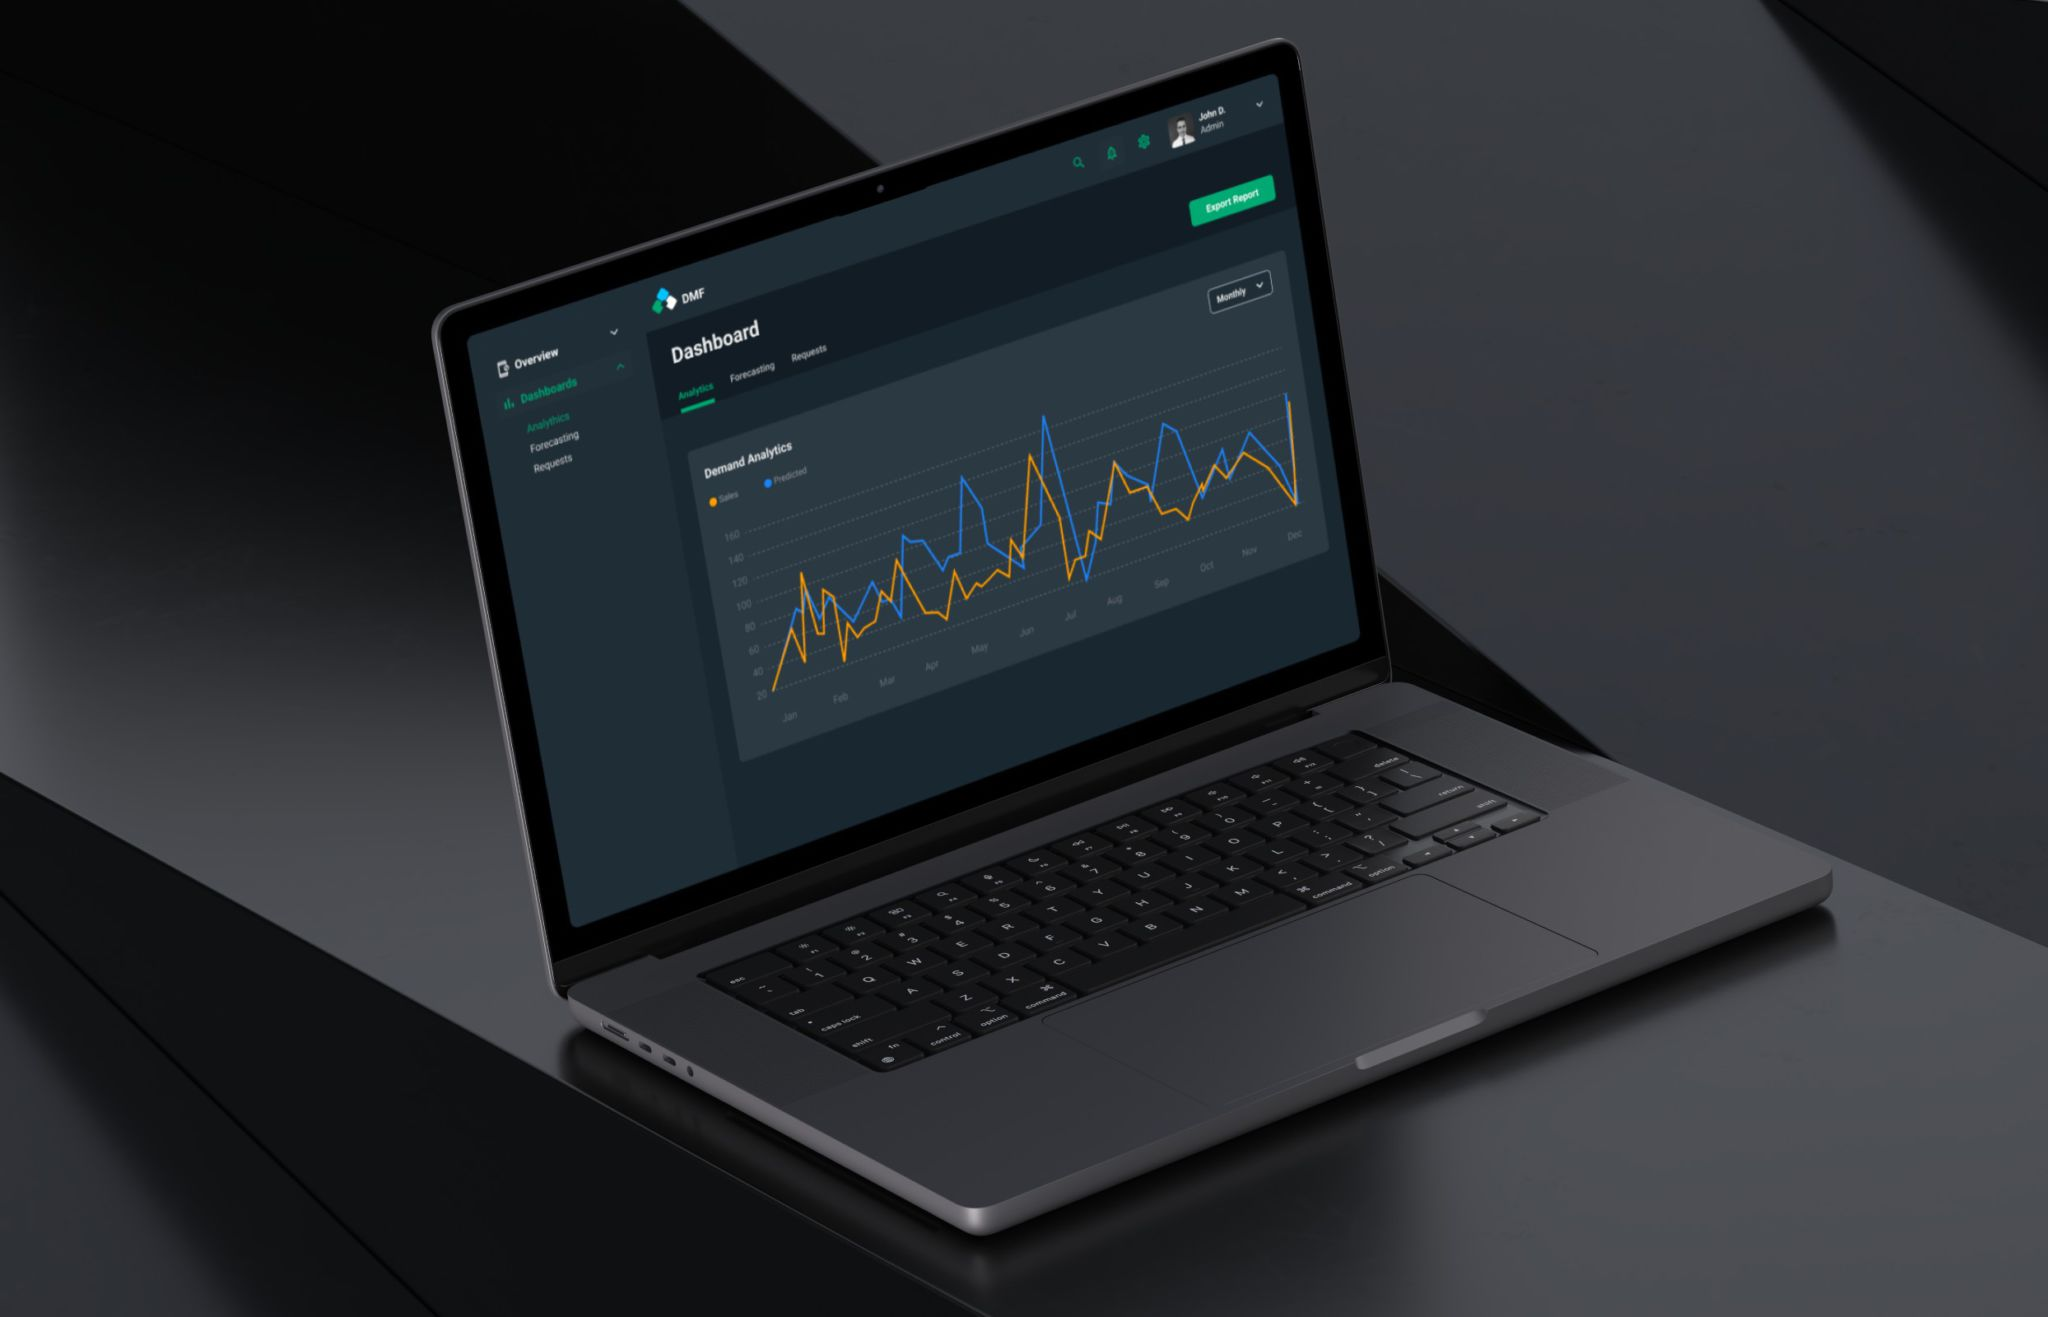
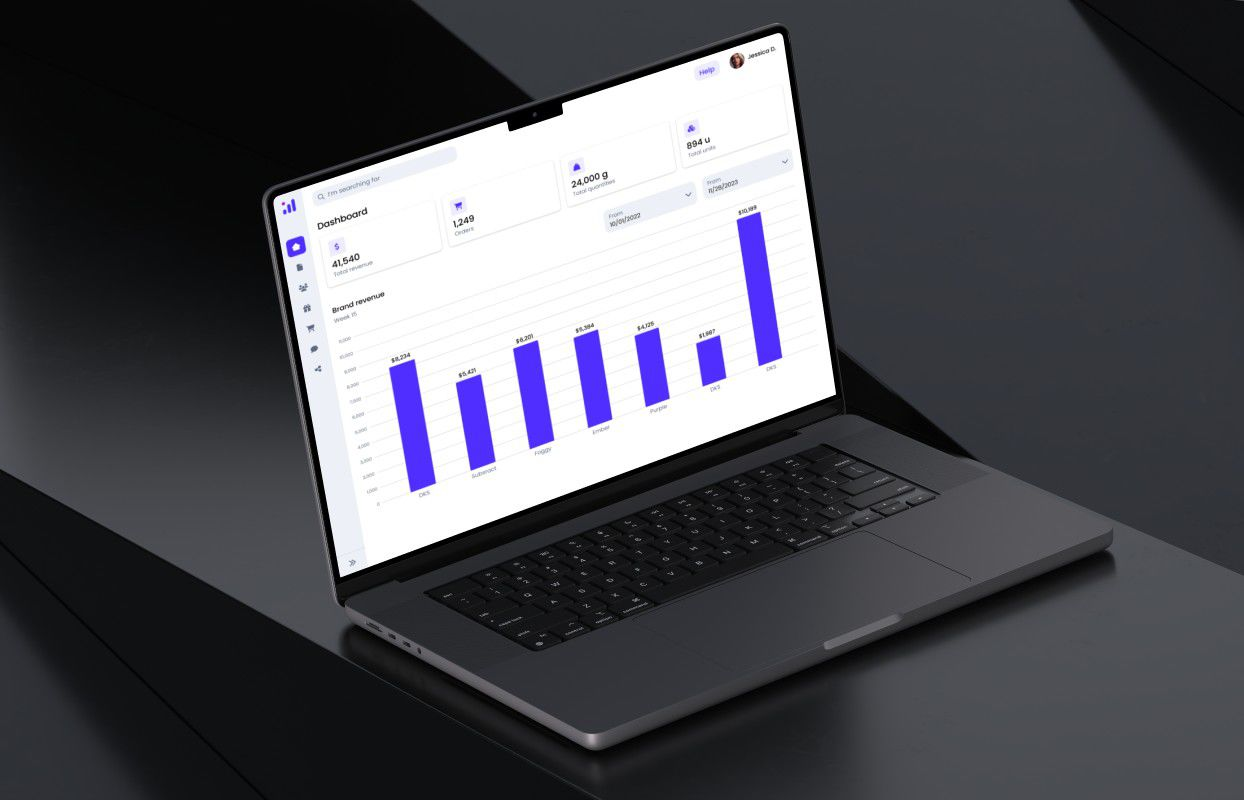
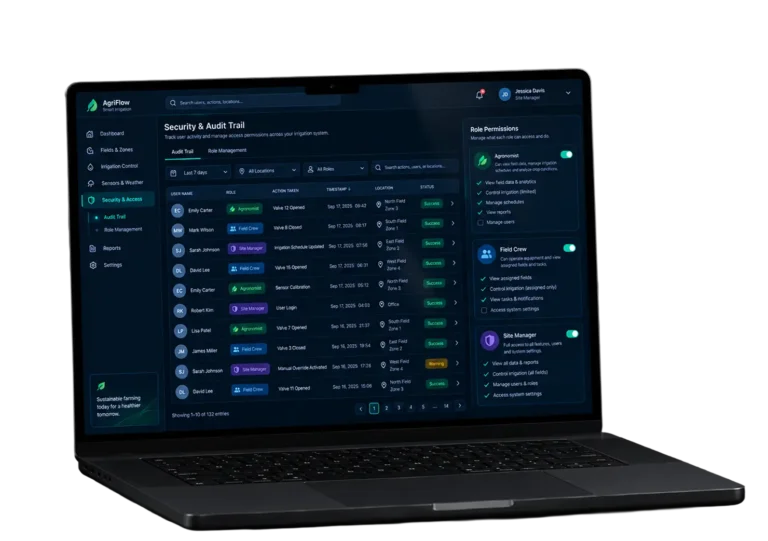
The internal sentiment analysis dashboard answers a narrower question. Merchandisers open it to see which SKUs need attention this week, so the first screen is a ranked table with sentiment score, 7-day delta, and review count. Aspect breakdown and the raw text analysis sit one click deeper, where the detail earns its space. Applying sentiment analysis across a catalog this wide only produces meaningful insights when the person reading the screen can trace any number back to the sentence that caused it.
Timeline
Five phases, clearly defined
Discovery & Product Workshop
- Mapping four review sources and their schemas
- Agreeing a 12-aspect taxonomy with two category managers
- Choosing regression over five-class sentiment classification
Model Prototyping
- Building the lexicon and TF-IDF baseline for comparison
- Fine-tuning BERT on the first 200,000 reviews
- Measuring mean absolute error against a held-out set
Agile Development (Sprints)
- Training on the full 1M-review dataset
- Building the sentiment analysis pipeline and the REST API
- Shipping the dashboard first, then the mobile views
QA & Testing
- Hand-scoring 5,000 reviews for a human comparison
- Load-testing the API at 5,000 reviews per batch
- Working through short-text and non-English edge cases
Launch & Support
- Deploying to AWS with ONNX Runtime for inference
- Watching for drift on a monthly review sample
- Retraining quarterly on fresh customer feedback
Results
Before
- ✕2% of reviews read by hand, roughly 2,500 out of 120,000 a month
- ✕Three analysts spending about 12 hours a week on manual tagging
- ✕Negative sentiment surfacing after nine days on average
- ✕Support tickets and social mentions carrying no sentiment score at all
- ✕Four channels, four exports, no single view of customer sentiment
After
- ✔100% of incoming reviews scored automatically across all four channels
- ✔0.38 MAE on the 1-5 scale, with 94% of predictions inside one star
- ✔Negative sentiment spikes flagged in under 24 hours
- ✔Manual tagging down ~85%, from 12 hours a week to under two
- ✔One dashboard ranking every SKU by sentiment score, refreshed nightly
Impact of the Solution for Predicting Customer Satisfaction After Launch
Verified Reviews
Our Reputation on Leading Platforms
Clients rate LITSLINK 4.8 on top platforms. Reviews mention technical depth in machine learning, steady communication across time zones, and a willingness to challenge data quality before anyone writes code. This project is part of our broader AI as a Service practice, where we help clients turn complex AI ideas into production-ready products.
Ready to Build Your AI Solution for Analysis?
Need a sentiment analysis solution that reads customer feedback the way your buyers actually write it? Tell us what you sell and where the reviews live. We come back within 48 hours with an approach, a rough timeline, and the names of the people who would build it.
Thank you for your message. It has been sent.