





Building an AI-Powered Predictive Analytics Platform for Sales Forecasting
- 91% forecast accuracy
- 3× lower forecast error, from roughly 27% down to about 9%
- 6 data sources merged into one automated pipeline
- 7 weeks to the forecasting engine, ~4 months end-to-end
A predictive analytics for sales platform turns years of scattered sales data into forecasts a retail team can actually plan against. We built one for a large US retailer. Sales leaders stopped guessing at next quarter and started reading it off a chart.
Project Details
A large US retailer approached LITSLINK with years of historical sales data scattered across six systems and no dependable way to forecast demand by category.


Business Challenge: Building Accurate Sales Forecasting Systems
Retail demand swings with season, promotion, weather, and a dozen things nobody controls. Get the forecast wrong, and it costs money both ways: order too much and stock sits in a warehouse, too little and the shelf goes empty while customers walk. A forecast is a bet on future events, and the retailer’s kept losing.
Before this project, the retailer forecast sales the way plenty of mid-market chains still do, in spreadsheets, by hand, one category lead at a time. Historical sales data lived in six disconnected systems and got reconciled maybe once a month. Predictions drifted far from actual results, often by more than a quarter.
Predictive analytics only works on clean, centralized inputs, and neither was true here. Traditional sales forecasting by spreadsheet could not keep up, so the whole sales process leaned on gut feel, and nobody trusted the numbers enough to plan against them. They had spreadsheets, not analytics tools. What was missing was predictive sales analytics they could trust.

Accurate revenue predictions
Manual forecasts missed real demand by roughly 27% on average. Nothing tied predictions to exact purchase dates, order quantities, or future revenue by category, so sales leaders had no confident number to build targets on, and the sales process stalled on it.

Real-time data integration
Sales, inventory, pricing, and promo data sat in six separate sources that rarely lined up. Pulling one clean history for a single category took days, which made frequent, reliable forecasts effectively impossible.

Scalable prediction infrastructure
Every new product line meant another spreadsheet and another hand-built model. Nothing retrained on its own, predictions went stale within weeks, and the work simply did not scale past a handful of categories.
Technologies Behind Predictive Sales Analytics





Our Sales Forecasting & Analytics Software Solution
One question shaped the build: how do you turn a decade of noisy sales records into a number a category manager will order against? The answer was less about any single model and more about the pipeline feeding it. Garbage in, garbage out is not a cliché in demand forecasting. It is the whole game.
The retailer’s demand signal was real, but it was spread across six systems that never spoke to each other. Point-of-sale here, inventory there, pricing, promotions, and customer data somewhere else. We built a Python pipeline that pulls all of it in, cleans it, aligns it on a shared calendar, and hands the models one coherent history per product category.
On top of that history sit auto-trained predictive models, a mix of statistical time-series methods from statsmodels and gradient-boosted models via scikit-learn and XGBoost. The system picks and tunes the best approach per category instead of forcing one algorithm on every product. A Flask REST API serves each forecast, and the whole thing runs on AWS, so it grows with the catalog rather than against it. For the deployment side, the team leaned on its cloud services practice.
Forecasts refresh on a schedule. The pipeline retrains weekly on the latest sales data, so predictions track current market trends instead of last season’s. Through predictive analysis, the models identify patterns in historical demand that a spreadsheet never surfaces, and use them to predict outcomes twelve months out: expected units, likely purchase timing, and projected revenue per category, all read straight off the dashboard.
None of this is an off-the-shelf report. The models were fit to this retailer’s categories, its promo cadence, and its messy source data, which is why the accurate predictions held up once real orders started flowing through them.
Auto-trained forecasting models
The platform tests several predictive models per category and keeps the one that scores best on recent history through continuous predictive analysis. No data scientist babysits each SKU, and forecast accuracy holds as demand patterns shift.
Unified data pipeline
Six data sources, from sales and inventory to pricing and promotions, feed one automated pipeline. Cleaning and alignment that used to take days now runs in the background, handing the models clean historical sales data every cycle.
Flask prediction API
A lightweight Flask REST API returns any category's forecast in well under a second. Other retailer systems call it directly, so predictions flow into planning tools without a manual export.
Interactive analytics dashboard
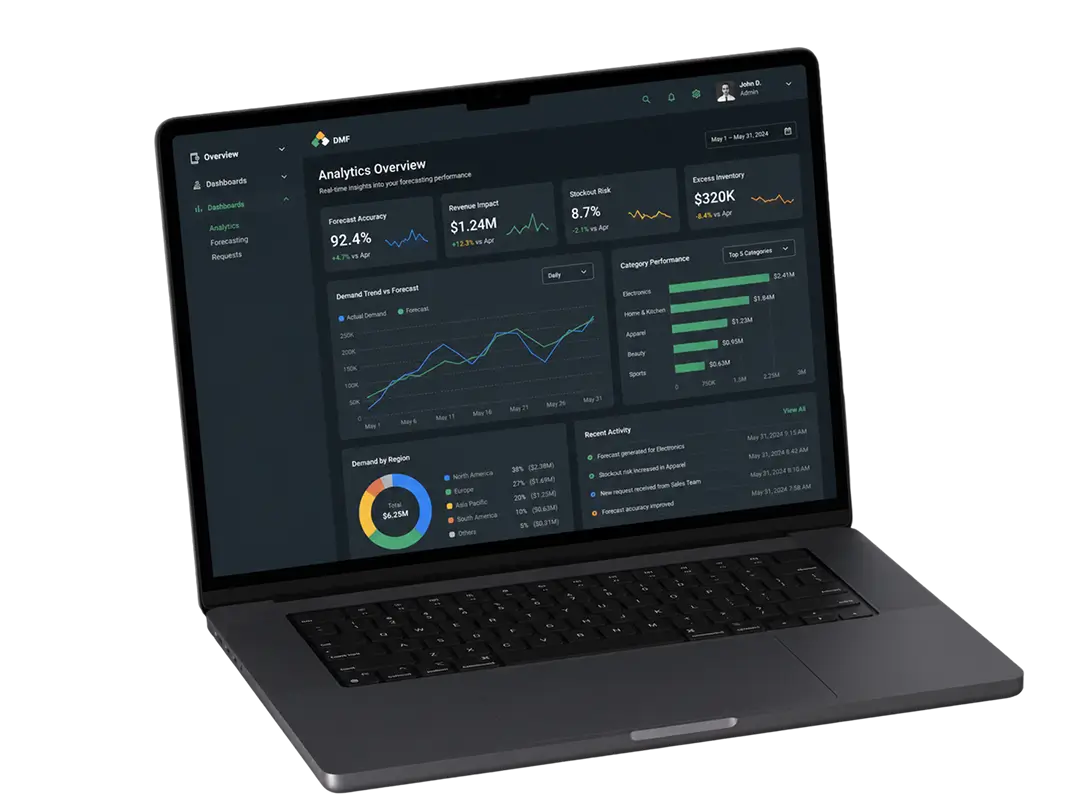
One web dashboard shows sales versus predicted demand, category sales performance, and forecast confidence. Unlike generic analytics tools, it puts predictive insights up front, not last month's totals. Category managers read next quarter off a chart instead of stitching together five spreadsheets.
Category-level demand forecasting
Forecasts break down to the product-category level, with expected quantities and purchase timing. Buyers see what to order and roughly when, which is where the revenue and the inventory savings come from.
Automated weekly retraining
Models retrain on their own each week on AWS. Predictions stay current with customer behavior and seasonal swings, so the numbers don't quietly rot between manual updates.
Scrum Methodology
Project Journey
The build ran in two-week sprints over about four months. Early cycles went into the data pipeline, not the models, because a forecast is only as good as the history behind it and that history was in rough shape. Getting six sources to reconcile cleanly ate most of the first three sprints.
Discovery mapped every data source, the categories that mattered most to revenue, and how far ahead the retailer really needed to see. We settled on a 12-month horizon at monthly granularity, then worked backward to what the models and the pipeline had to deliver.
How Our Platform for Predictive Sales Analytics Works
- Sales, inventory, pricing, and promo records pull in from six source systems into one place.
- The pipeline dedupes, fills gaps, and aligns everything on a shared monthly calendar.
- Auto-trained models fit per category, picking the best statistical or gradient-boosted approach.
- Each model outputs a 12-month view: units, purchase timing, and projected revenue by category.
- Forecasts land on the web dashboard as sales-versus-predicted charts and category scorecards.
- Every week the models retrain on fresh sales data, so predictions track current demand.
Scrum Process Flow
AI development on a forecasting system lives or dies on data quality, so short cycles mattered here. Two-week sprints let the retailer check predictions against real sales as each category came online and catch model drift before it hardened into a bad model. By the time the full catalog was loaded, the pipeline had been corrected in a dozen small steps instead of one painful rebuild.
How we deliver your project
- We define the project goal together, agree on priority features, and set a realistic delivery date and budget.
- We build a ranked list of everything the product needs, starting with what matters most to the business.
- Work is broken into 2-week cycles. At the start of each, we select the next set of features to deliver.
- The team builds, tests, and integrates features throughout the sprint.
- At the end of every sprint, you see working software and give feedback that shapes the next cycle.
- Each sprint produces a shippable piece of the product. We review what worked, adjust, and move forward.
-Timeline
Five phases, clearly defined
Discovery & Data Assessment
- Auditing all six data sources for quality and coverage
- Ranking product categories by revenue impact
- Fixing the 12-month, monthly forecast horizon
Model Prototyping
- Testing statistical against gradient-boosted models per category
- Backtesting predictions on three years of held-out history
- Setting the accuracy bar the pipeline had to clear
Agile Development (Sprints)
- Building the Python multi-source data pipeline
- Wiring auto-training and the Flask prediction API
- Building the analytics dashboard on the model outputs
QA & Testing
- Validating forecast accuracy category by category
- Load-testing the API for sub-second responses
- Checking dashboard numbers against source-of-truth data
Launch & Optimization
- Deploying to AWS with weekly auto-retraining
- Monitoring live forecast error against actuals
- Tuning models as new categories come online
UI/UX Design: Intuitive Sales Analytics Dashboard
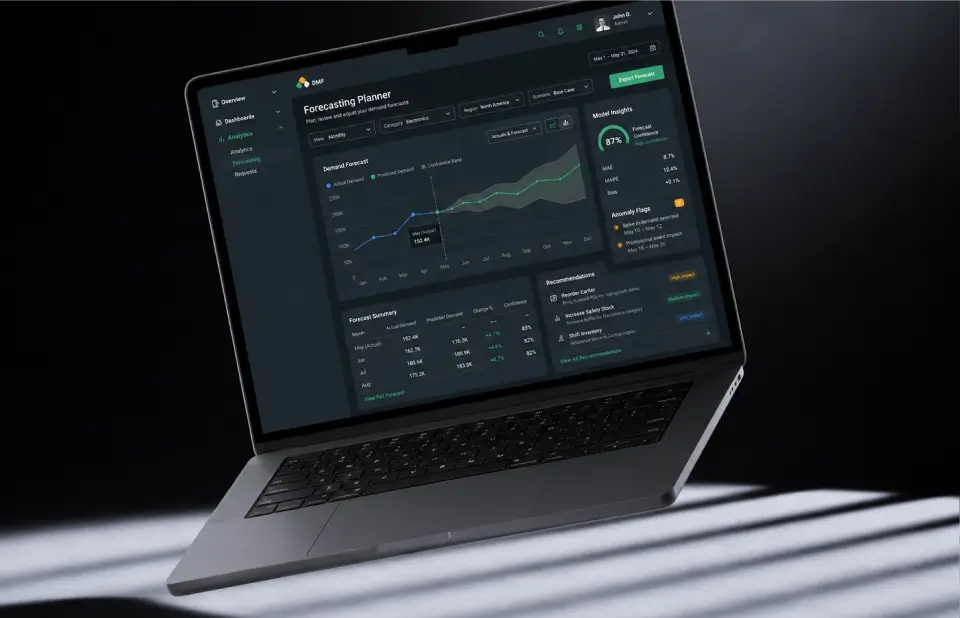
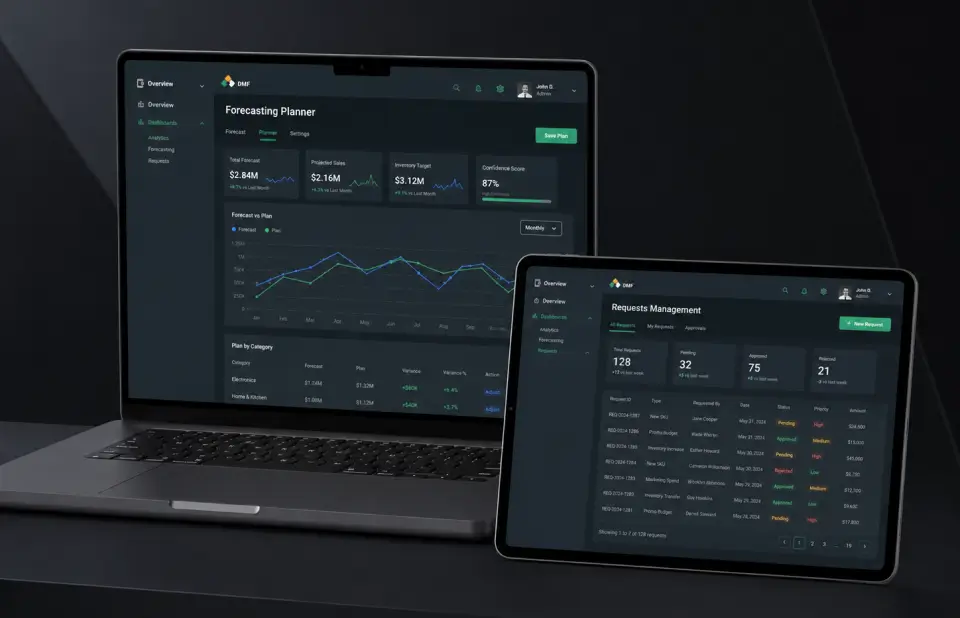
The dashboard has one job: let a category manager see next quarter and track sales performance without opening a spreadsheet. Everything else bends to that. The layout runs dark by default, a deep slate background with a green accent, so the two lines that matter, actual sales and predicted demand, catch the eye first.
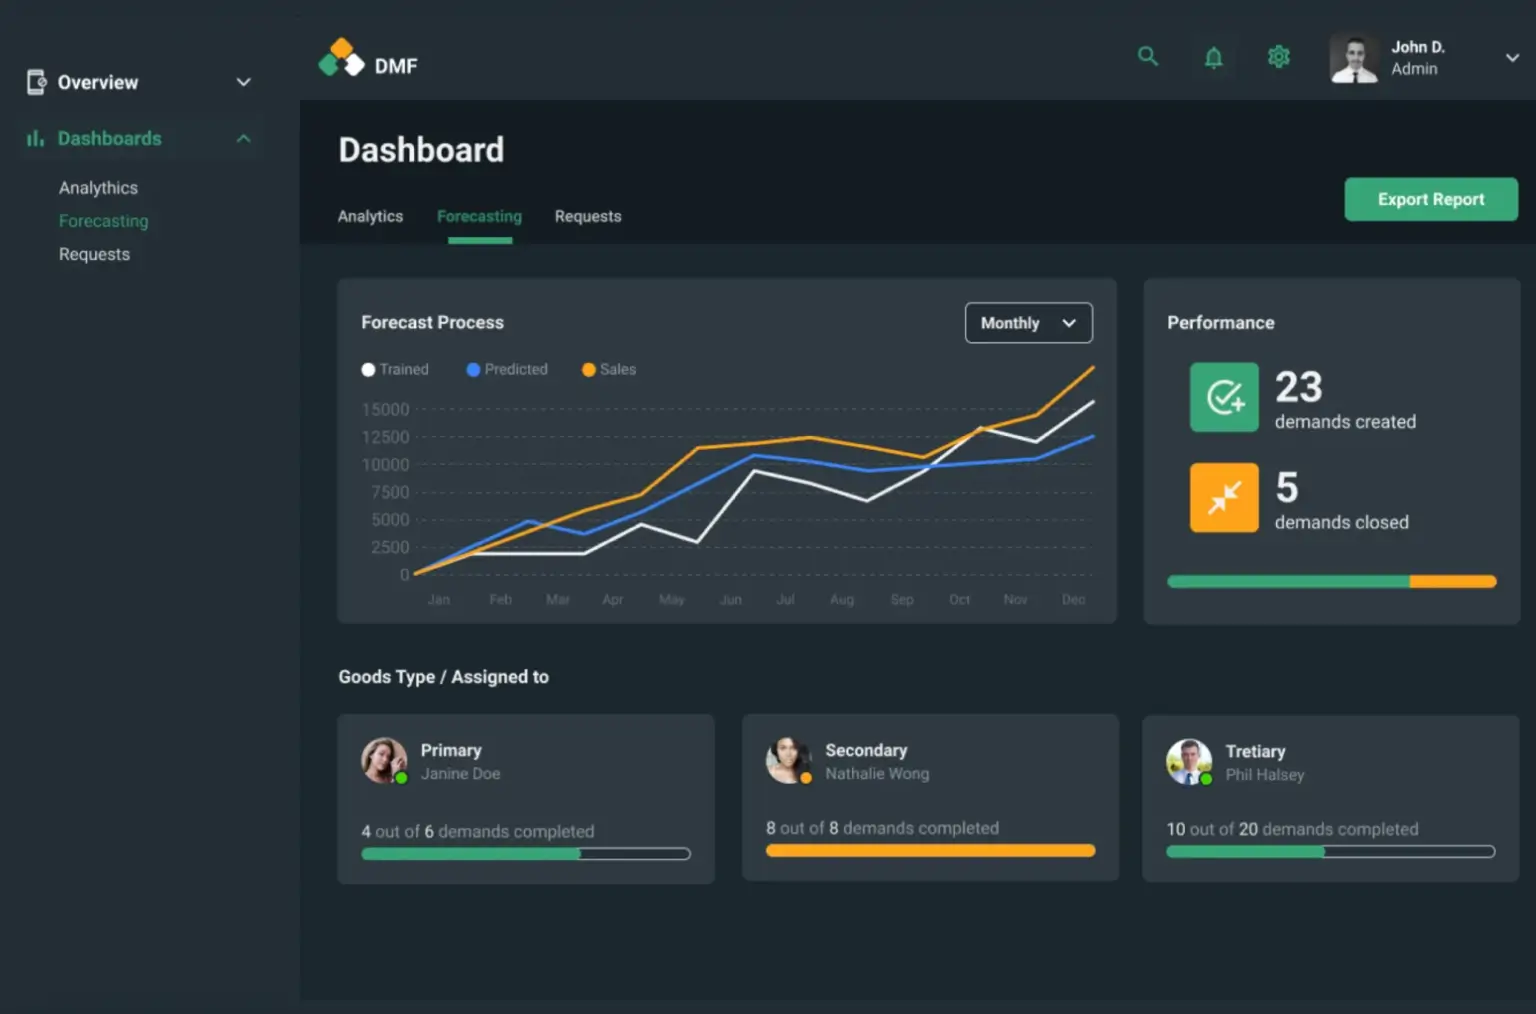
Category managers don’t read tables of numbers. They read shapes. So the main Demand Analytics view plots sales against the model’s prediction as two overlaid lines, orange for actual and blue for forecast, across the twelve months. Where the lines diverge is where the conversation starts. A Forecasting tab layers in a third line, the trained baseline, for anyone who wants to see how the model learned.
Navigation stays shallow. A left rail holds Overview and three dashboards, Analytics, Forecasting, and Requests, and that is the whole map. A Monthly toggle switches granularity, an Export Report button ships the current view to whoever needs it, and small Performance cards track demands created against demands closed. Goods are split into Primary, Secondary, and Tertiary, each with an owner and a completion bar, so the work behind a forecast has a face and a status.
The result is a screen a buyer can scan in ten seconds and act on in one. No export, no reconciliation, no waiting on the analytics team.
Results
Before
- ✕Manual sales forecasting in spreadsheets, roughly 2–3 days per cycle.
- ✕Forecast error near 27%, with revenue targets set on gut feel.
- ✕No predictions tied to purchase dates, quantities, or category revenue.
- ✕Historical sales data scattered across six systems, reconciled monthly at best.
- ✕No way to refresh forecasts, so numbers went stale within weeks. No shared view.
After
- ✔91% forecast accuracy from auto-trained machine learning models.
- ✔Forecast error cut to about 9%, roughly 3× more accurate than before.
- ✔34% revenue increase across the categories the forecasts optimized.
- ✔6 data sources merged into one automated pipeline, refreshed continuously.
- ✔Weekly auto-retraining keeps predictions current, all in one dashboard.
- ✔65% better use of storage capacity as overstock came down.
The Impact
-Verified Reviews
Our Reputation on Top Platforms
LITSLINK is consistently rated among the top AI and machine learning development companies on top review platforms. See more of our machine learning work.
Have a Sales Forecasting Project in Mind?
Thinking about predictive sales analytics, or sitting on years of sales data you have never really used? Tell us what you need to forecast, and we will come back within 48 hours with a scope and a number.
Thank you for your message. It has been sent.