






Building ESG Monitoring Software With AI-Powered Document Clustering
- 600+ distinct topics surfaced from a year of news coverage
- ~14 min to cluster 10,000 articles on AWS, down from weeks of manual tagging
- ~11 hrs/week returned to each compliance analyst
- ~70% lower monitoring cost per company tracked
Compliance teams read the news for a living, and most of it is noise. We built ESG monitoring software that takes a year of press coverage about a company, groups every article by the topic it actually discusses, and shows an analyst which environmental, social, and governance themes are growing before the auditor asks.
Project Details
An enterprise compliance team came to us with four companies to watch, one year of press coverage for each, and no reliable way to say what those articles were about. Archives ranged from roughly 2,100 articles to 19,000 per company, sorted by hand or not at all. They wanted a platform that reads everything, finds the themes on its own, and shows where the ESG exposure sits.


Business Challenge: Building Automated ESG Data Processing for Compliance Teams
The compliance team’s media monitoring setup was a shared inbox of news alerts and brand mentions, a spreadsheet with 14 handwritten tags, and two analysts reading whatever arrived that morning. About 38,000 articles had piled up in twelve months. Fewer than 6,000 carried a tag, and even those disagreed: one analyst filed a factory emissions story under “Environment”, the other under “Regulation”.
They had trialed two media monitoring tools built for enterprise PR, Agility PR Solutions among them. Those suites are AI PR toolkits for marketing teams and communications teams: they monitor brand mentions across online conversations, score media impact, keep a media database and media relationships in order, and handle media relations work like press release distribution and media outreach. Good for a communications strategy and for brand reputation. For tracking brand mentions, even visual brand mentions in video, they work well. For ESG risk they did not, because they answer “who wrote about us” and never “what is the coverage actually about”. Press materials and PR efforts were not the problem here.
The gap showed at quarter-end. Sustainability reporting asked one question: what did the press say about labor, emissions, or board conduct, and how did that picture of ESG performance change month to month? Answering it took three weeks of reading, and the answer still depended on who read. Risk management wanted the same numbers in near real time. Nobody could give them.

Accurate ESG Content Classification
Keyword filters tagged a "green" product launch as environmental news and missed a lawsuit that never said "governance". About 40% of hand-applied tags disagreed with a second reviewer, so the ESG data behind the reports could not be trusted.

Scalable Document Processing Pipeline
Archives from 2,100 to 19,000 articles broke every fixed-cluster method the team tried. Settings tuned for the small one collapsed the large one into a few vague groups, and rerunning from scratch each week was not an option.

Regulatory Compliance Data Structure
Auditors wanted sustainability data tied to ESG pillars, with dates, sources, and article counts they could trace. A folder of PDFs gave them none of that, and each regulatory compliance request restarted the exercise by hand.
Technologies Behind the ESG Monitoring Platform


Our AI-Powered ESG Monitoring Solution
One decision shaped the build: the platform would not be told what topics to look for. Predefined ESG taxonomies, the kind most ESG software and ESG reporting solutions ship with, were part of the problem, because news moves faster than any category list. So we built topic modeling software that discovers the themes in a corpus, then lets the analyst name each one and map it to an environmental, social, or governance pillar. Those mapped topics become the ESG metrics the reports are built on, and the sustainability management team reads them the same way the compliance team does.
Text goes in as a database with news about the tracked companies, either as a one-time upload or through automated data collection from feeds. Data integration is deliberately plain: title, body, source, date. Data preprocessing strips boilerplate, removes syndicated reprints (about 17% of the raw archive), and normalizes dates. BERT turns each article into an embedding, UMAP reduces the dimensions, and HDBSCAN finds clusters without being told how many to find. That last point mattered most. The same pipeline handled the 2,100-article company and the 19,000-article one.
BERTopic extracts the words that define each cluster. LDA stayed in the stack for one job: a cheap pass on very short wire items, where the transformer approach cost more and found nothing extra. River handles incremental learning, so a new article joins its topic in about two seconds instead of forcing a full re-cluster.
Everything runs on AWS: a GPU instance for batch clustering, a small always-on service for dashboard and API calls. The first run over all four archives surfaced 602 topics. About 70% mapped to an ESG pillar automatically from their keywords, and an analyst reviewed the rest in an afternoon. The key capabilities below are what the analysts open every day.
AI-Based Document Clustering
BERT embeddings, UMAP, and HDBSCAN group articles by what they discuss rather than the keywords they contain. The lawsuit that never says "governance" lands next to the ones that do. Analysts confirmed about 91% of sampled clusters as coherent on first review.
Real-Time News Monitoring
New media mentions from online news feeds and news sites join a topic within seconds through River's online learning. When a cluster grows faster than its 90-day baseline, the dashboard flags it, so emerging risks surface before they reach a headline. Media monitoring at this level is about topics, not mentions.
ESG Risk Assessment
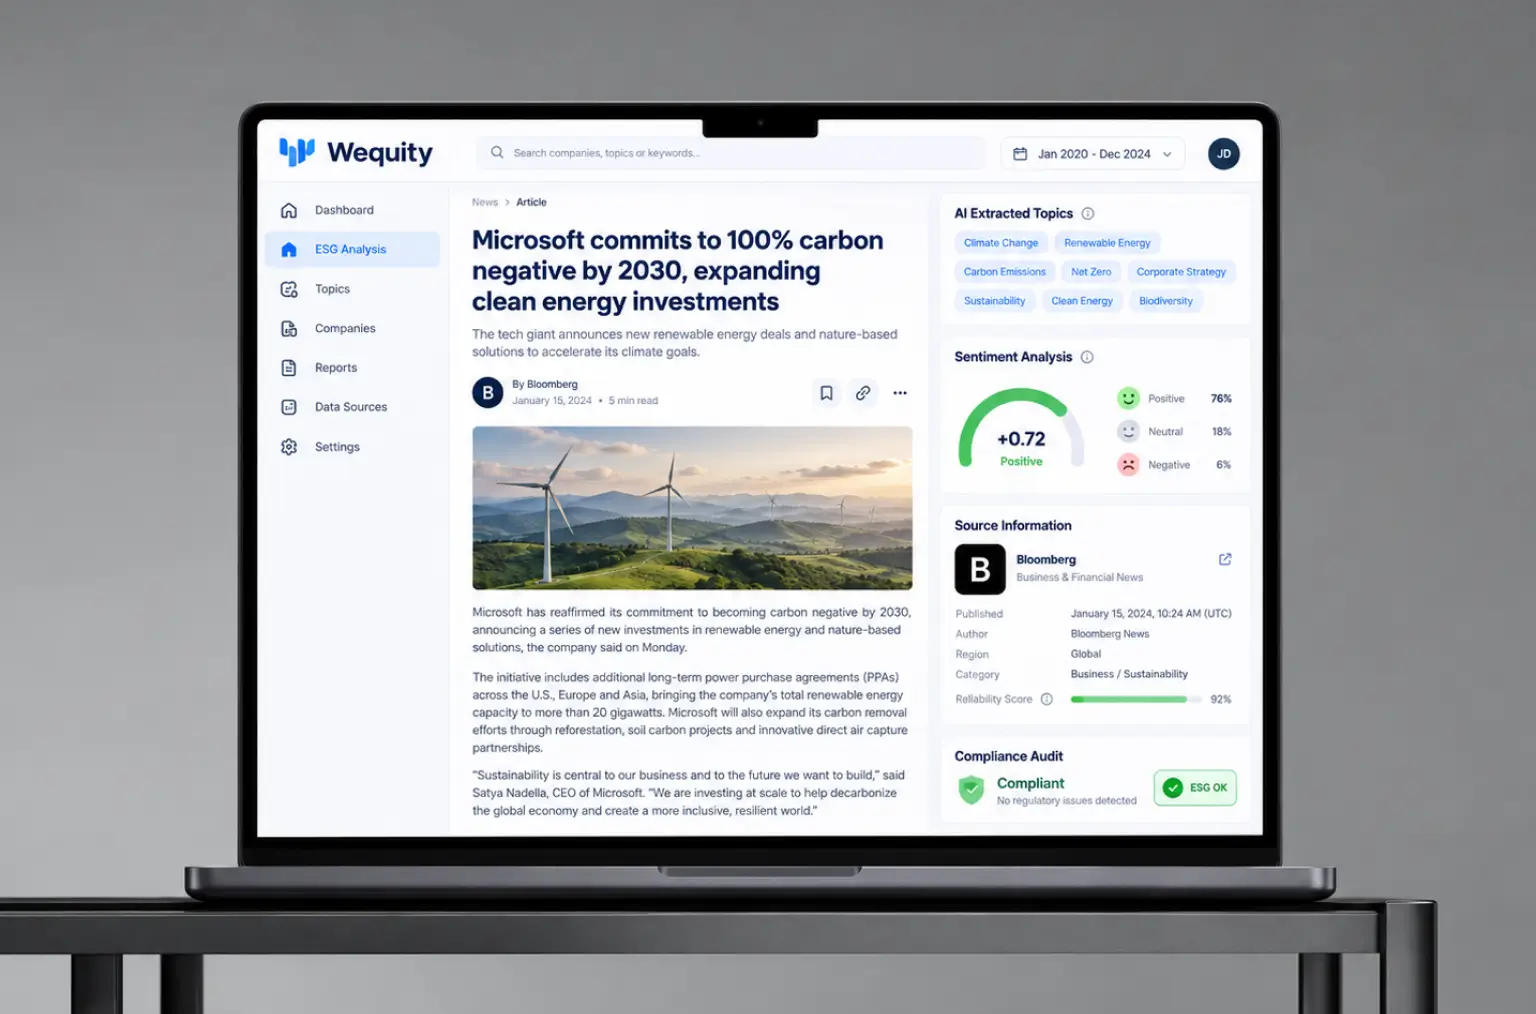
Each topic carries an E, S, or G label, an article count, a velocity score, and a 30-day sentiment analysis signal. A small topic rising with negative tone ranks above a large, stable one, letting the team identify risks by trend rather than volume.
Multi-Framework Reporting
Topics export into the pillar structure the client's ESG reporting software already uses, with dates and source links per article, which extends its ESG reporting capabilities without replacing it. A quarterly summary of sustainability performance that took three weeks of reading now assembles in under an hour, and downstream reporting processes stop waiting on it.
Interactive Dashboard
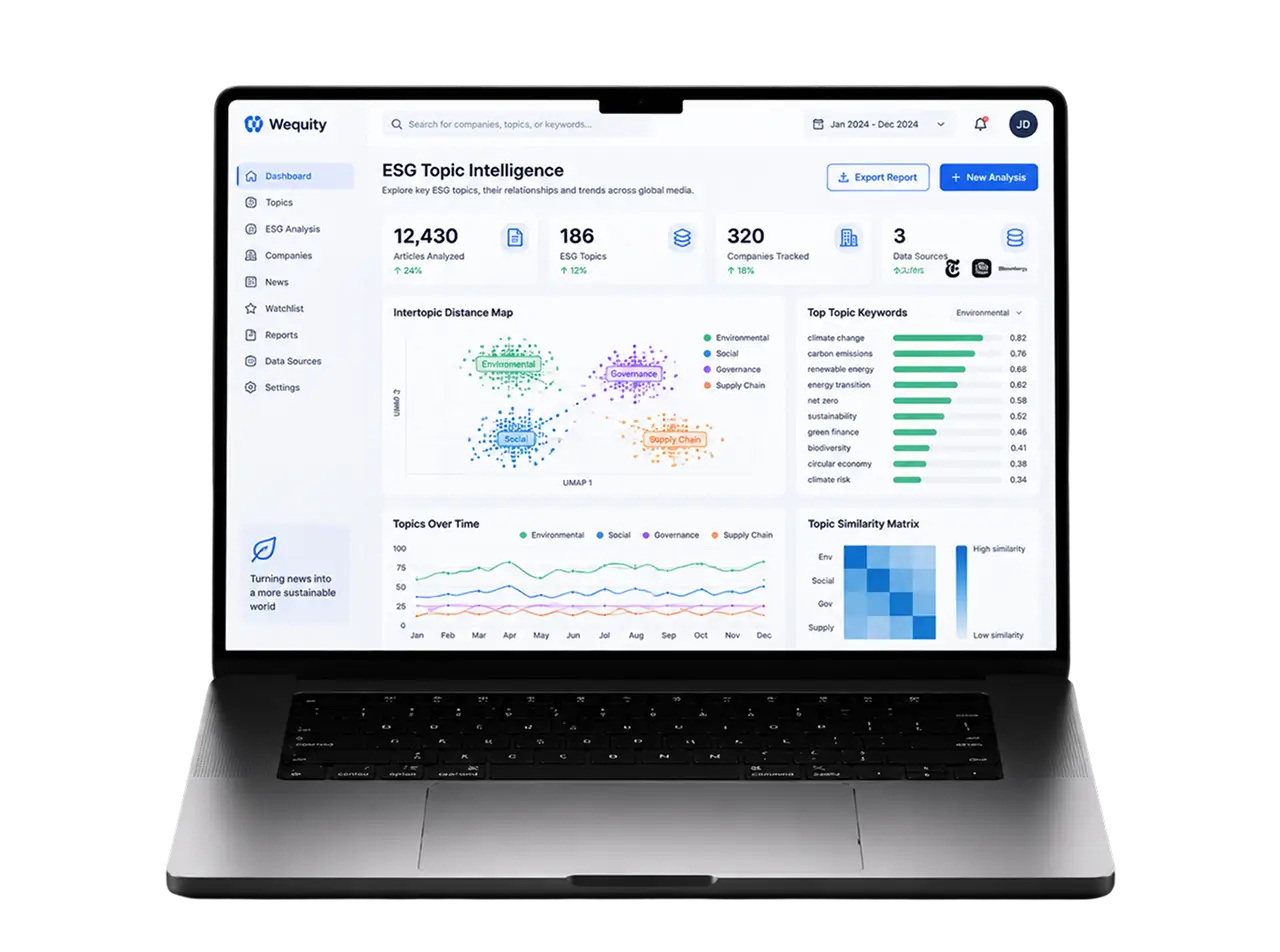
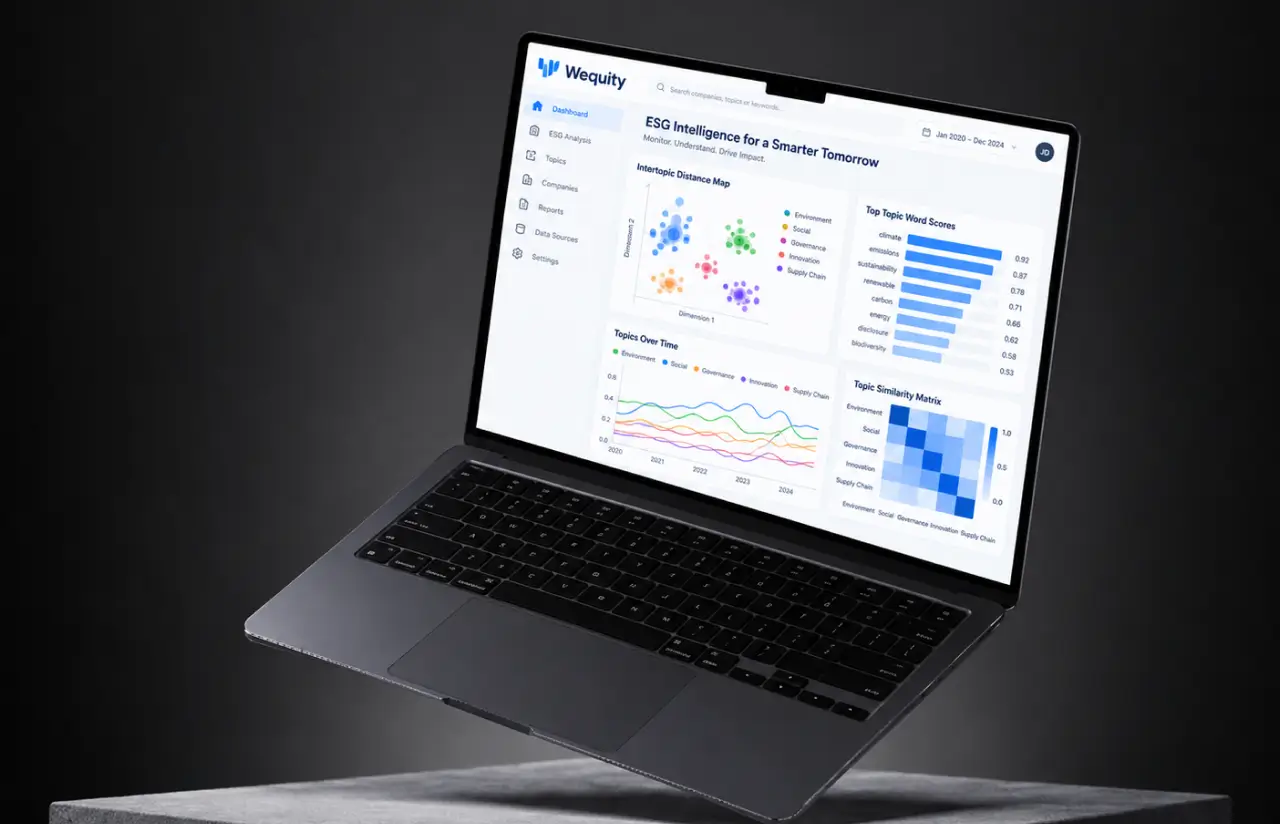
An intertopic distance map, per-topic word scores, a topics-over-time chart, and a similarity matrix share one screen. Data visualization is the point: every panel is backed by quantitative data the analyst can export as actionable insights, from topic 1 to topic 602.
API Access
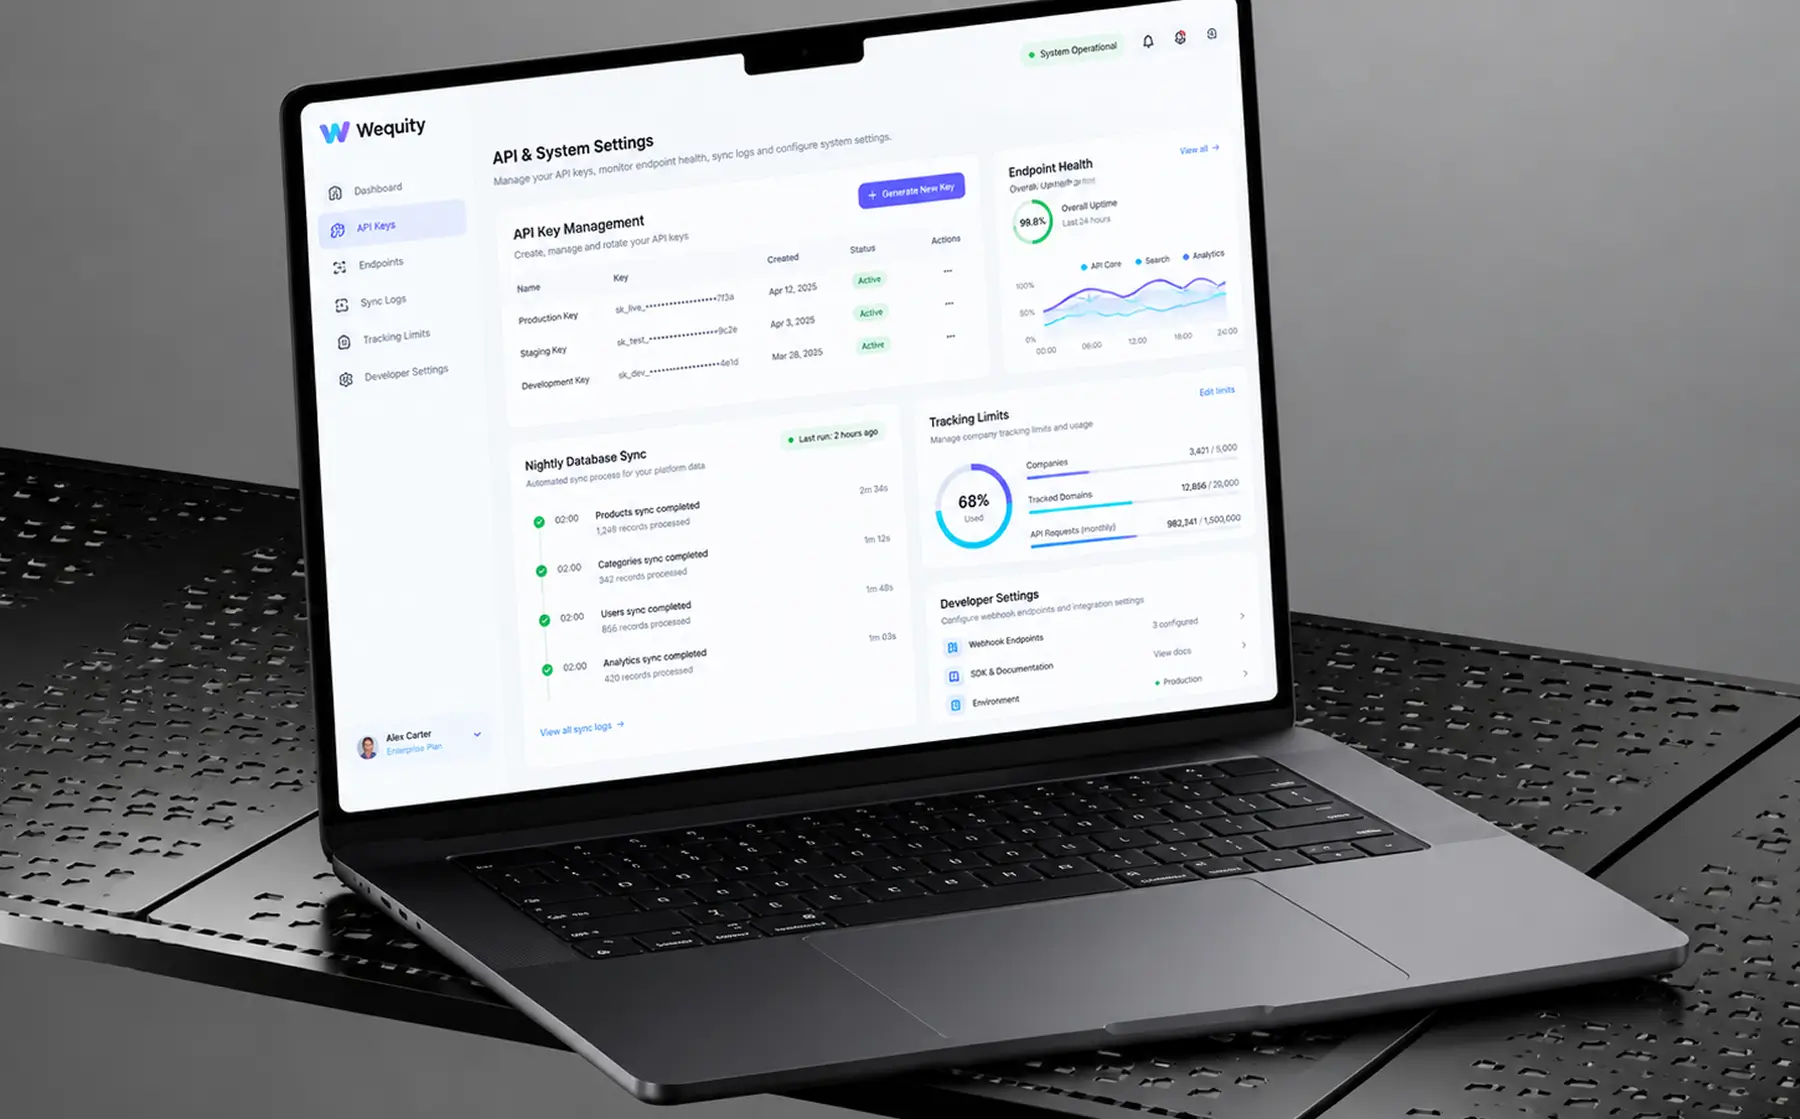
Everything the dashboard shows is also served through an application programming interface. The client's risk management and monitoring tools pull topic counts and analytics nightly, and a bulk endpoint accepts a new company's archive without touching the UI. Articles never leave the client's own AWS account.
Scrum Methodology
Project Journey
The project ran in two-week sprints from day one, with the first three spent on data collection and cleanup: pulling four archives from multiple channels into one format, removing 17% duplicate content, and agreeing on what a “good” cluster looks like before training anything. Discovery also settled the hardest product question: predefined topics or discovered ones. The team chose discovery, and that call held for the whole build.
How the News Monitoring Software Works
- The analyst uploads a database with news about one or more companies, or points the API at a feed. Title, body, source, and date are the only required fields.
- Boilerplate, navigation text, and syndicated reprints are removed. Around 17% of the first archive was duplicates that would have skewed every topic count.
- A BERT model converts each article into a vector. Short wire items take a lighter LDA pass, saving the GPU budget for long-form pieces.
- UMAP projects the vectors into a lower-dimensional space, and HDBSCAN groups them. Cluster count is not fixed, so a 2,000-article archive and a 19,000-article one both divide sensibly.
- BERTopic extracts the defining words per cluster. About 70% of topics map to E, S, or G automatically, and the analyst confirms or corrects the rest.
- River assigns new articles to topics as they arrive, velocity and sentiment scores update, and the dashboard or API feeds the compliance monitoring workflow.
Scrum Process Flow
Machine learning development on unlabeled data carries a specific risk: a clustering that looks clean in a notebook can be useless to the person who has to read it. So every sprint review put fresh clusters in front of the two compliance analysts, and their coherence ratings became a tracked metric from sprint 4 onward. Two of those reviews changed the pipeline outright, once to add deduplication and once to route short items through LDA.
How We Delivered ESG Monitoring System Project
- We define the project goal together, agree on priority features, and set a realistic delivery date and budget.
- We build a ranked list of everything the product needs, starting with what matters most to the business.
- Work is broken into 2-week cycles. At the start of each, we select the next set of features to deliver.
- The team builds, tests, and integrates features throughout the sprint.
- At the end of every sprint, you see working software and give feedback that shapes the next cycle.
- Each sprint produces a shippable piece of the product. We review what worked, adjust, and move forward.
UI/UX Design: Intuitive Interface for ESG Data Analysis
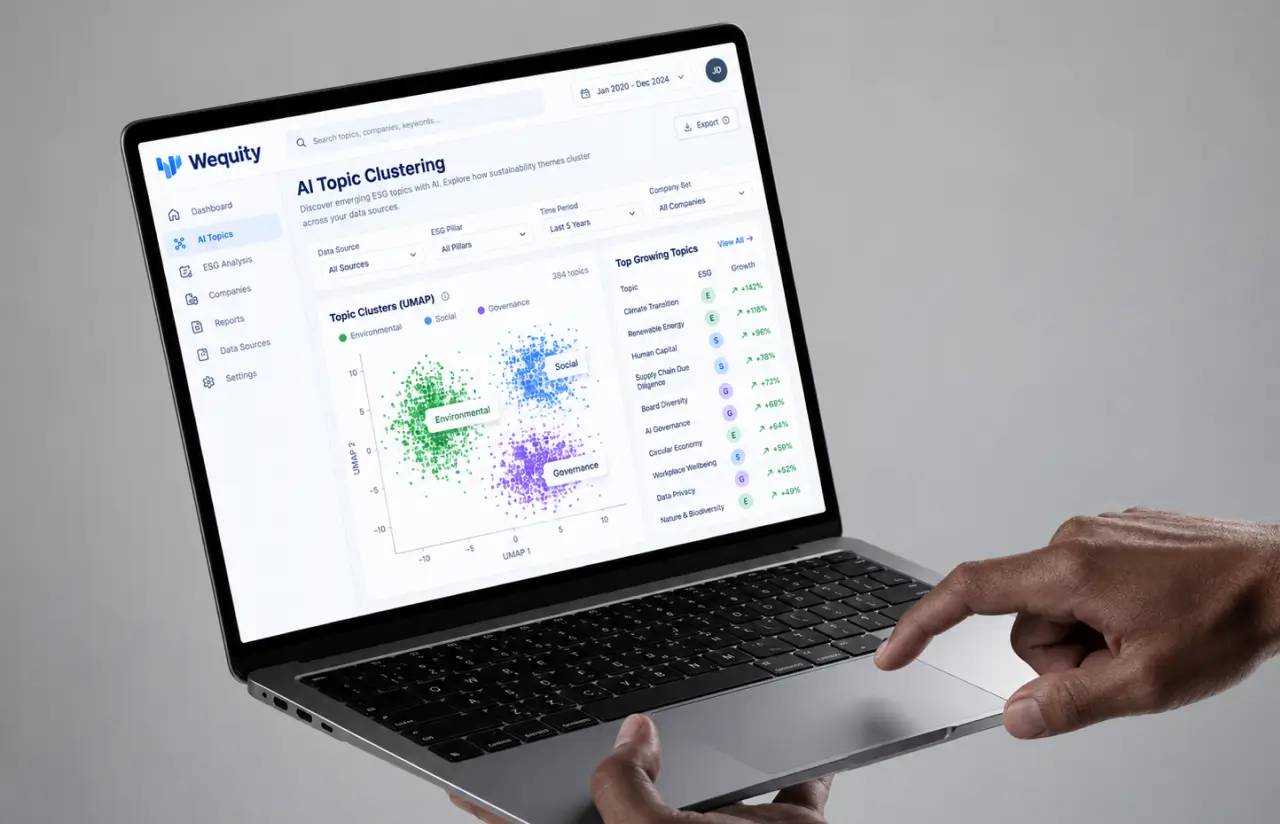
The design brief was short: an analyst should find the topic that matters in under a minute, without knowing which of 600 topics to look for. That ruled out a long list. It also ruled out anything that hid the relationships between topics, because “emissions litigation” sitting next to “plant closures” is often the finding.
We watched both analysts work a week of alerts before drawing screens. They rarely read a whole article. They scanned for the company name, judged the theme from the first paragraph, and moved on. So the dashboard leads with the intertopic distance map, a scatter of clusters where proximity means shared vocabulary, plus a slider that walks through topics one at a time. Hovering shows top words; clicking opens the source articles. Three more panels fill the screen: topic word scores, a topics-over-time chart that makes a rising theme obvious at a glance, and a similarity matrix for when someone asks whether two topics should merge.
Every chart carries a text label and a color, and the same views collapse into a mobile layout for the compliance lead who checks morning flags on a phone. The UI stays out of the way of data analysis: numbers are visible, sources are one click away, and no prior knowledge of what the model found is required.
Results
Before
- ✕~38,000 articles across four companies, fewer than 6,000 hand-tagged, with ~40% tag disagreement between reviewers
- ✕Quarterly ESG topic summary took ~3 weeks of reading per cycle
- ✕Each analyst spent ~14 hours a week scanning alerts and filing stories
- ✕Rising themes were noticed only after they reached a major headline
- ✕No shared database, no topic history, and no way to answer an auditor's question without restarting
After
- ✔602 topics discovered automatically, with ~91% confirmed coherent by analysts
- ✔Quarterly summary assembles in under 1 hour from the dashboard export
- ✔~11 hours a week returned per analyst, from 14 hours of scanning to about 3
- ✔Rising topics flagged when growth passes a 90-day baseline, typically 5 to 8 days before peak coverage
- ✔One centralized database for topics, sources, dates, and ESG pillar mapping: a unified platform for data management, available through the dashboard and the API
Impact of the ESG Monitoring Platform After Launch
Verified Reviews
Our Reputation on Top Platforms
LITSLINK holds a 4.8 rating on top platforms. Clients writing about our AI development and cloud services work most often mention technical depth in NLP and machine learning, steady communication over long engagements, and a habit of questioning a requirement when the data points elsewhere.
Have an ESG Monitoring Project in Mind?
Need ESG monitoring software for a compliance team, or news monitoring software? Tell us what you track today (companies, sources, monthly volume), and a LITSLINK specialist gets back to you within 48 hours. You can also hire AI developers from our team to extend a platform you already run.
Thank you for your message. It has been sent.