





Building Game Analytics Software to Predict Player Behavior and LTV
- 18% more in-game purchase revenue
- 5-point lift in D7 retention
- 84% churn prediction accuracy
- 3,200+ dynamic levels generated daily
Mobile studios lose most new players before day seven and rarely find out why. LITSLINK built game analytics software for a US mobile publisher that predicts which players will churn, what they are likely to buy, and which level to serve next, so the studio can act while the player is still in the session.
Project Details
The client is a US-based mobile publisher with a portfolio of casual puzzle titles built in Unity and about 2.1 million monthly active players. Their in-house team tracked installs and daily revenue in spreadsheets, and every question about player behavior took days to answer. They asked LITSLINK for a platform that turns raw data into predictions and feeds those predictions back into the games.


Business Challenge: Building Comprehensive Game Analytics for Modern Studios
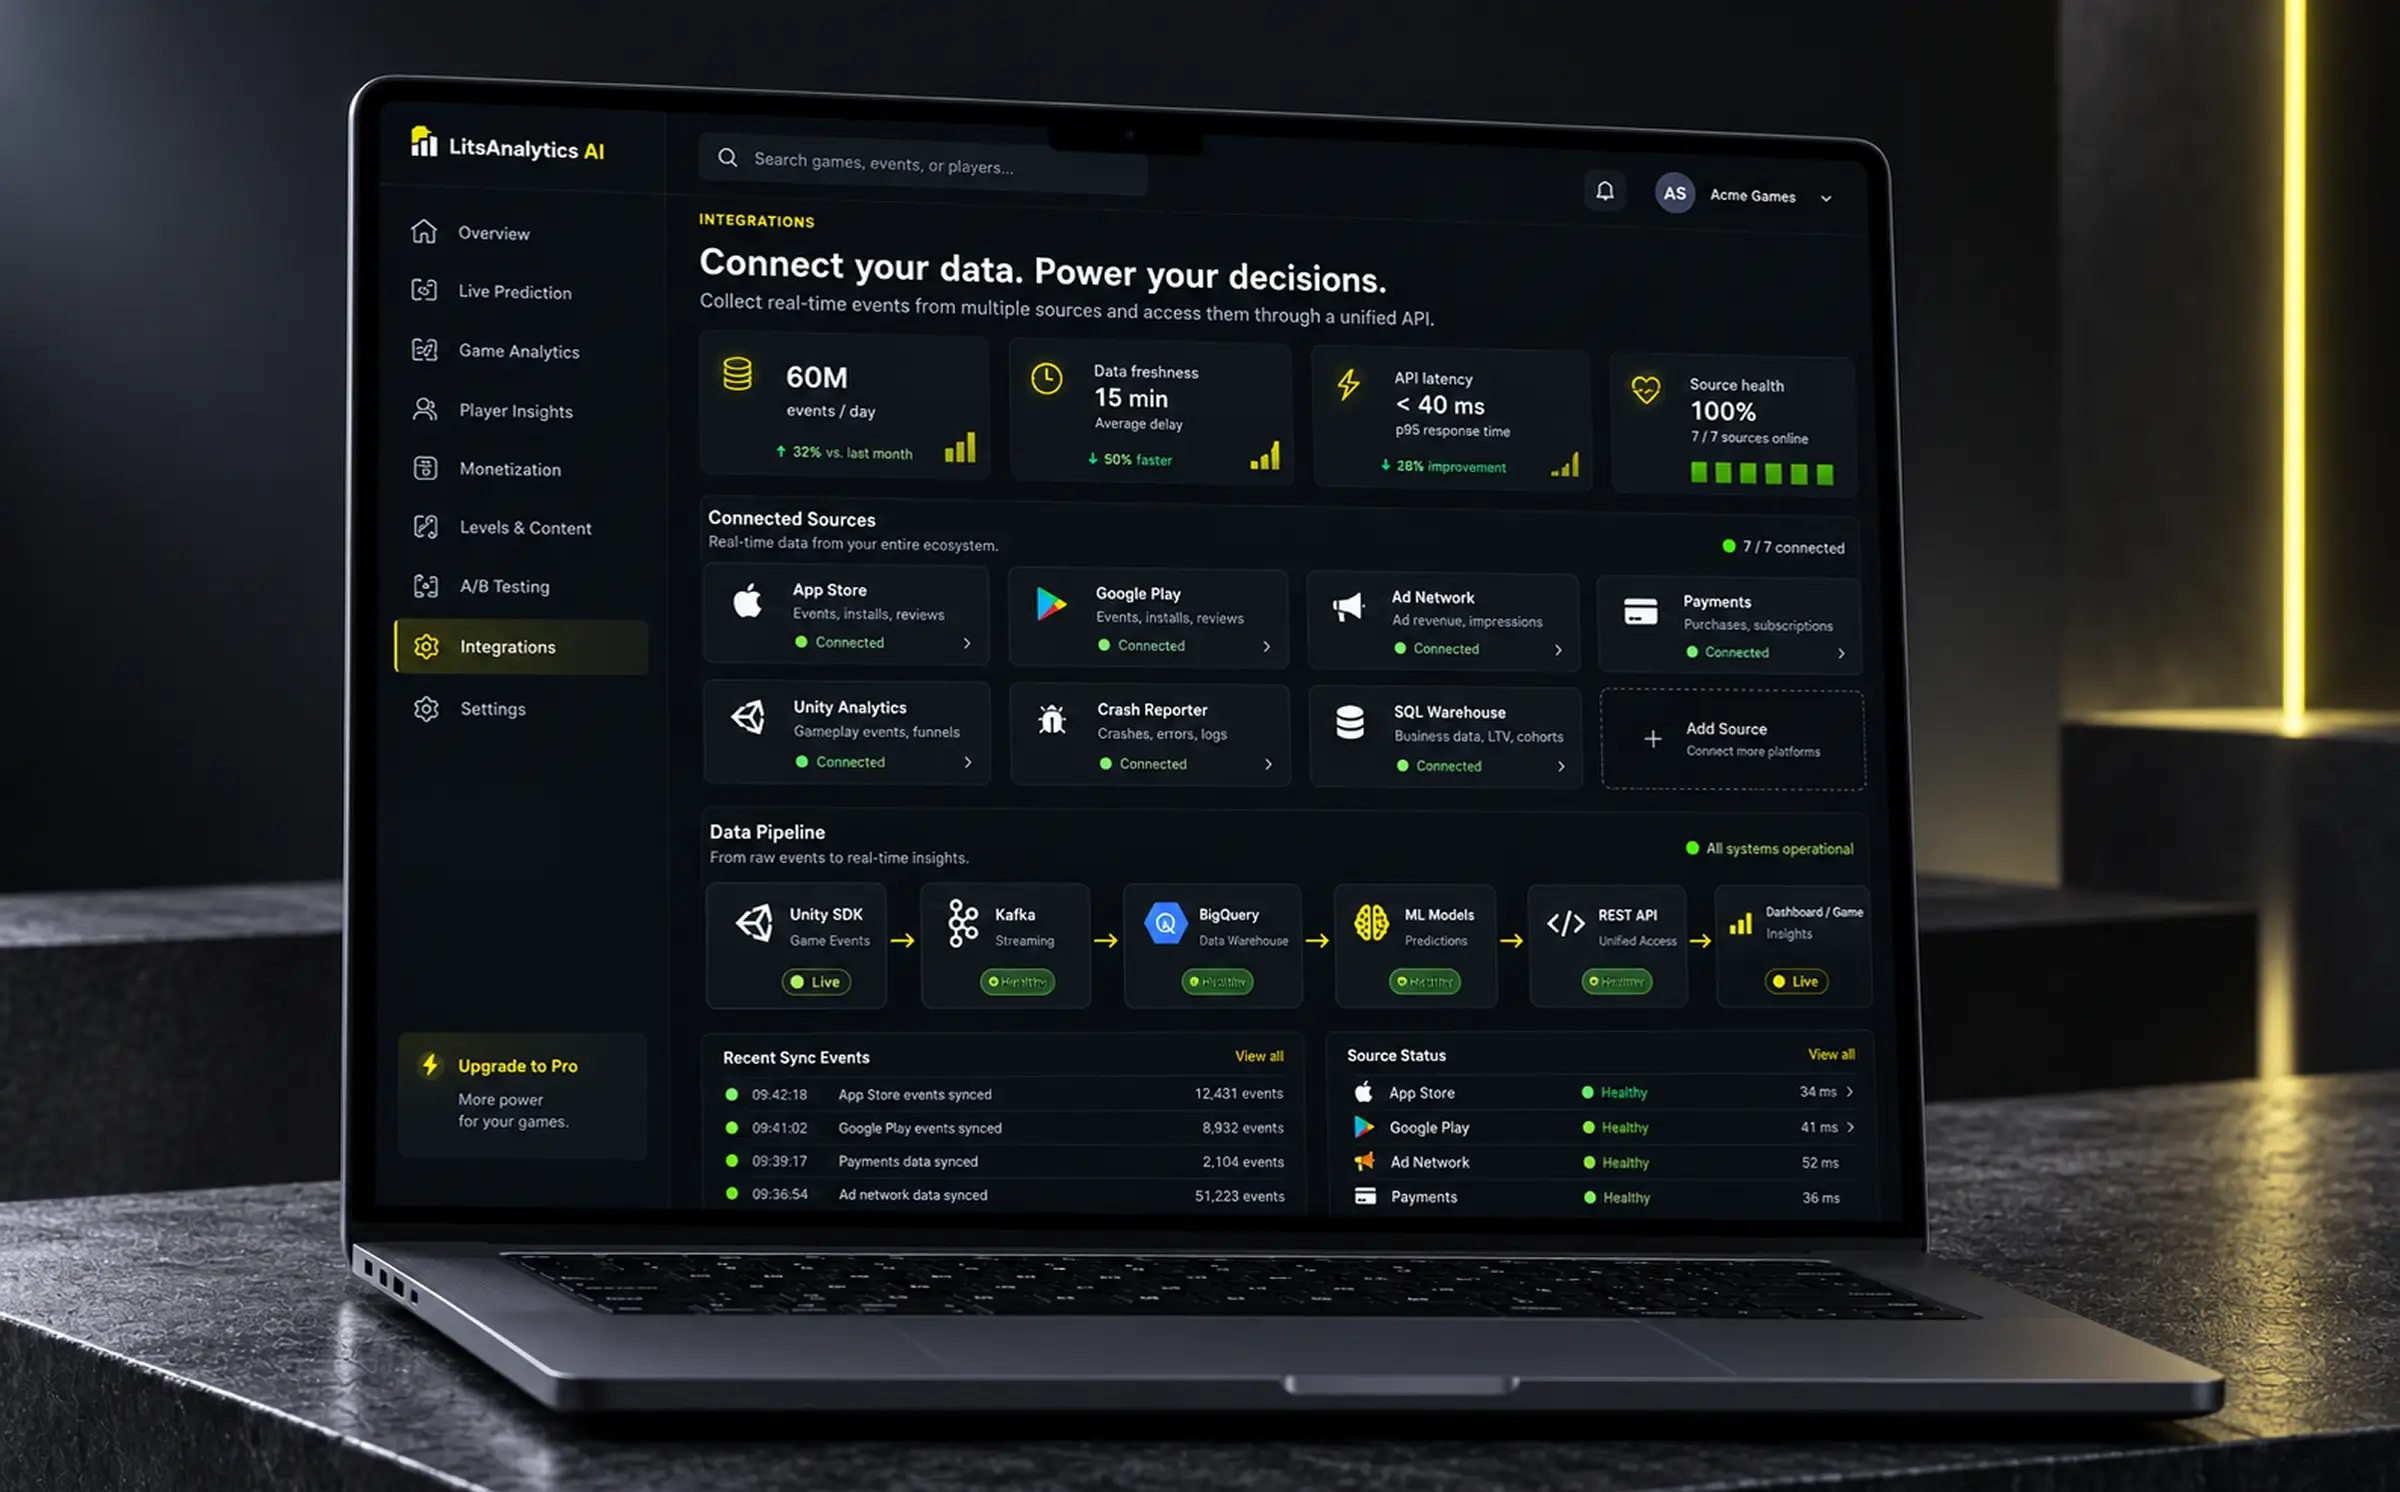
Before this project, the studio’s data lived in seven places: two app stores, an ad network, a payments provider, Unity Analytics, a crash reporter, and an internal SQL warehouse nobody trusted. Monthly reports arrived three weeks late. By then, the players in question were long gone, and in the gaming industry, a player who leaves in week one almost never comes back.

Churn Spotted Too Late
Churn rates were calculated once a month from store exports. A player who quit on day three showed up in the numbers in week five, long after any offer or level tweak could have brought them back.

One Difficulty Curve for Everyone
Every player got the same hand-built level sequence. Expert players ran out of content in ten days, casual players stalled around level 40, and both groups left. Designers had no way to adapt progression per player.

Monetization by Guesswork
In-game purchases were promoted to everyone at the same moments. The team could not tell which player groups responded to which offer, so discounts went to players who would have paid full price anyway.
Technologies Behind the Game Analytics Solution


Our Game Analytics Solution
We built a game analytics platform with three layers: a data pipeline that collects events from the games in real time, a set of predictive models trained on TensorFlow GPU, and a web dashboard where producers and designers get actionable insights without writing SQL.
The pipeline ingests around 60 million events a day from the Unity SDK through Apache Kafka into BigQuery. Raw data is cleaned, filtered, and stitched into sessions within seconds, so every model works on what a player did a minute ago.
On top of that data infrastructure sit three models. A churn model scores every active player daily. A purchase-propensity model predicts which players are likely to convert on an offer and when. A level-generation model, trained on completion rates and session lengths across 40+ hand-designed levels, assembles new levels tuned to a player’s pace and skill.
Everything is exposed through a REST API. The games call it to fetch the next level or the next offer, and the dashboard calls it to render funnel analysis and cohort views. The client’s own developers can plug new data sources into the same API.
Player Churn Prediction
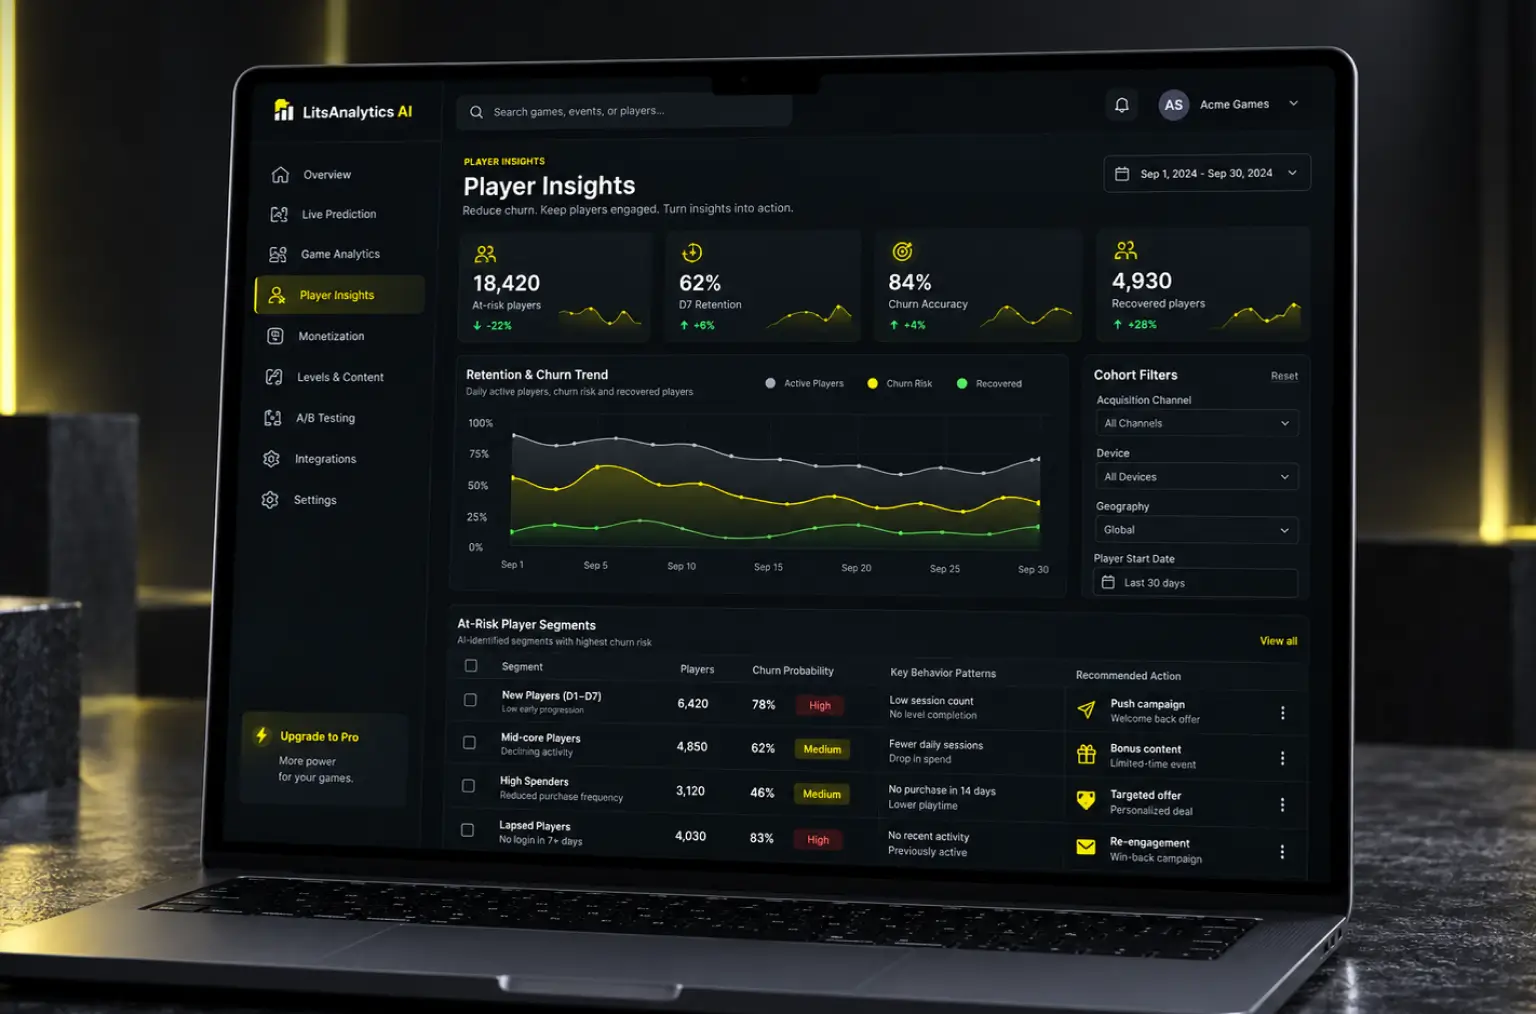
A daily risk score for every active player, built from session frequency, level progression, and spend history. Producers see who is at risk this week, grouped by cohort, and can trigger an offer or a content push from the same screen.
Dynamic Level Generation
Procedural level generation driven by player preferences. The model tracks which mechanics a player finishes fastest and which cause retries, then assembles the next level from proven building blocks at the right difficulty. Over 3,200 levels a day at launch.
Purchase Propensity Scoring
Predicts the moment a player is most likely to buy and which in-game purchase fits. Offers go out to players who need a nudge, and full-price buyers are left alone. This one feature drove most of the monetization gain.
Funnel and Cohort Analysis
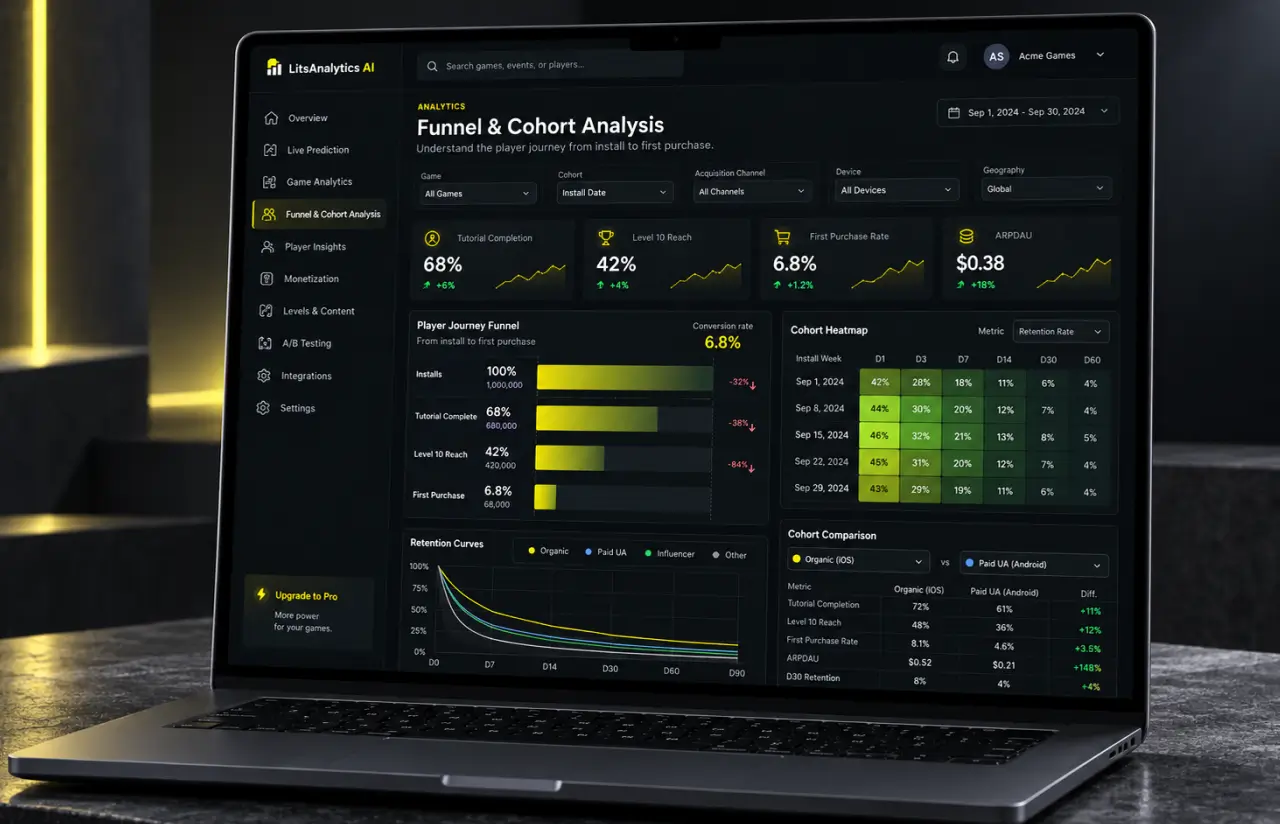
Track the player journey from install to first purchase, step by step, and compare player groups by acquisition channel, device, or start date. Drop-off points show up as numbers on a chart the whole team can read.
Real-Time Performance Metrics
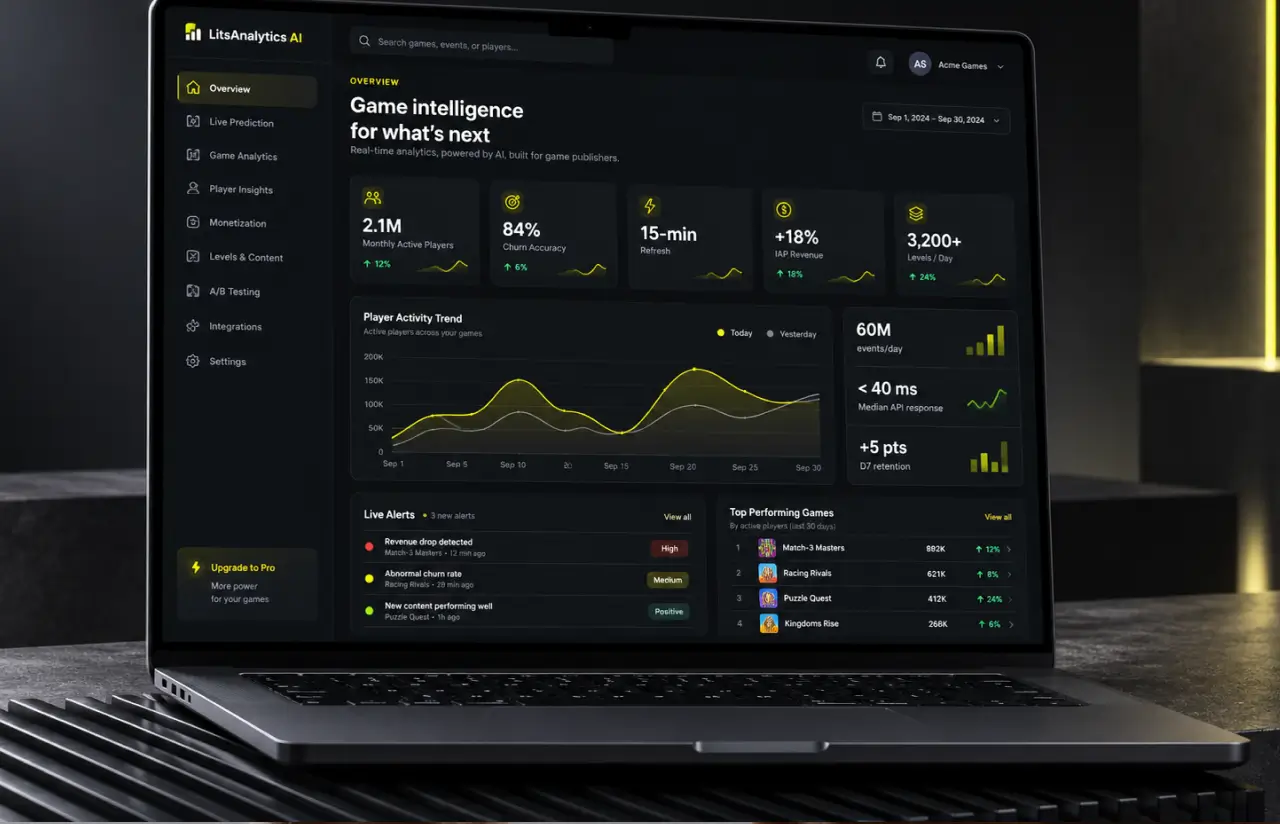
Live retention, session length, ARPDAU, and crash rates on one dashboard. Data refreshes every 15 minutes, so a bad build or a broken level shows up within the hour and gets fixed before it hits the weekly numbers.
Outcome Prediction API
Predicts session and match outcomes on the fly. Live ops teams use it to balance events, and the games use it to pick the next level. Median response time stays under 40 milliseconds.
Agile Methodology
Project Journey
The first two sprints went into a data audit, connecting all seven sources and agreeing on which events actually mattered. Models shipped from sprint five onward, and each one was A/B tested against a control group inside the live games before it was switched on for everyone.
How the Game Analytics Software Works
- Every session, level start, retry, and purchase is emitted by the Unity SDK and pushed through Kafka in under a second.
- Events land in BigQuery, get deduplicated and filtered, and are stitched into player sessions and cohorts.
- Churn and purchase-propensity models run on GPU nightly, with a lighter pass every hour for players currently online.
- The API assembles a level from tested mechanics, sized to the player's recent completion rate and session length.
- Producers see retention, funnels, and at-risk player groups in the web dashboard, with filters by cohort and channel.
- Offers, content pushes, and difficulty tweaks go out. Results feed back into training, and the models are retrained weekly.
Development Process Flow
Machine learning work on live games is risky if a bad model reaches players. So every model in this project went through a shadow phase: it scored players for two sprints without acting on them, and we compared its predictions to what those players actually did. Only models that beat the baseline by a clear margin were switched to active mode.
How We Delivered the Game Analytics Model
- We define the project goal together, agree on priority features, and set a realistic delivery date and budget.
- We build a ranked list of everything the product needs, starting with what matters most to the business.
- Work is broken into 2-week cycles. At the start of each, we select the next set of features to deliver.
- The team builds, tests, and integrates features throughout the sprint.
- At the end of every sprint, you see working software and give feedback that shapes the next cycle.
- Each sprint produces a shippable piece of the product. We review what worked, adjust, and move forward.
UI/UX Design
The dashboard was designed for producers and game designers, so the default view answers the questions they ask every morning: how many players are active, who is at risk, and what changed since yesterday. The overview screen shows status counts up top and a trend line comparing today with the previous day, with side metrics for throughput and response times. A dark theme with a single accent color keeps the charts easy to read through long sessions.
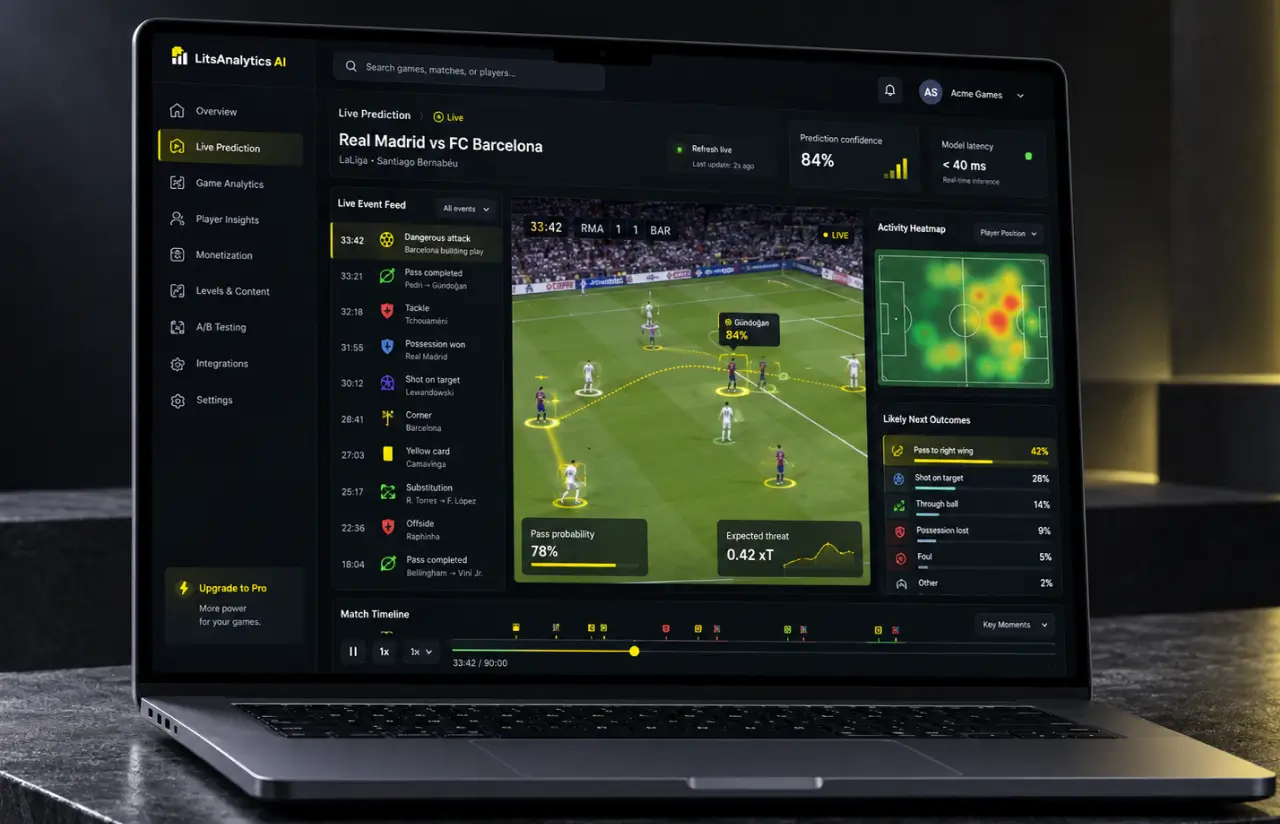
The live prediction view sits one click away. It puts a running event feed next to an activity heatmap and a probability panel that lists the most likely next outcomes with confidence scores. A timeline along the bottom marks key moments so an analyst can scrub back and see what led to a prediction.
Our product design team tested the interface with four producers from the client’s side across three rounds. Filters moved from a side panel into the chart headers after round one, and the average time to answer a cohort question dropped from about four minutes to under one.
Results
Before
- ✕Monthly retention reports, three weeks late
- ✕Churn visible only after players had already left
- ✕Same level sequence for all 2.1M players
- ✕Offers sent to everyone, ~2.4% conversion
- ✕Seven disconnected data sources, no single view
After
- ✔Live dashboard, data refreshed every 15 minutes
- ✔84% churn prediction accuracy (0.88 AUC), scored daily
- ✔3,200+ dynamic levels per day, tuned per player
- ✔Offer conversion up to 3.9%, +18% in-game purchase revenue
- ✔One platform across all sources, with an API for new ones
Impact After Launch
Verified Reviews
Our Reputation on Top Platforms
LITSLINK holds a 4.8 rating on top platforms. Clients point to the depth of our AI development team and the fact that the same engineers stay on a project from data audit to launch. Studios and publishers come to us when analytics has to feed decisions inside the game itself, and our cloud engineers keep the data infrastructure running once it does.
Have an Analytics Project in Mind?
Need game analytics software to predict player behavior, churn, and revenue? Share your games and data sources. Our specialist will reply within 48 hours with an initial assessment for a new platform or a predictive layer for your existing web app.
Thank you for your message. It has been sent.