





Building a Chronic Illness Tracker App With Symptom Analysis
- 7,000+ active users
- 10–15% monthly user growth
- Under 45 sec per daily check-in
- 300+ symptoms and conditions in the catalog
A chronic illness tracker only earns its place if logging a flare costs less energy than the flare itself. This chronic illness tracking app turns daily symptom logs into visual health histories and shareable reports that patients bring to doctor visits. Conditions, symptoms, treatments, medications, and triggers sit in one app, across web, iOS, and Android.
Project Details
The client is a US health-tech startup founded by people who watched the health care system leave patients with complex health needs to manage their health issues on paper. Their users walk into appointments with four or five health conditions, a shoebox of medications, and a fuzzy memory of which symptoms hit which week. They wanted a chronic condition management app that people would still open on a bad day.


Business Challenge: Creating a Comprehensive Chronic Illness Monitoring Platform
Patients with chronic illness rarely have one thing to report. One early tester logged migraines, allergic rhinitis, chronic fatigue, joint pain, and ocular rosacea inside the same week, alongside six medications and a supplement stack that changed monthly. Her symptoms did not line up with any single specialty, and neither did her questions.
Many apps in this space handle a single condition well. Track blood glucose, or track chronic pain, or track mood, and pick one. Each of those tools assumes your symptoms have a single owner. The client wanted all of it inside a single chronic illness tracker, and they wanted patients to still be logging symptoms in week twelve, which is where most mobile health applications quietly lose people. They asked for more than just an app. Wearable metrics like heart rate stayed out of version one on purpose, because a heart rate chart tells a patient with fibromyalgia very little about why yesterday hurt. Most mobile health tools ask about one set of health issues and stop there. Chronic disease management starts with what the patient notices.

Effortless Daily Condition Registration
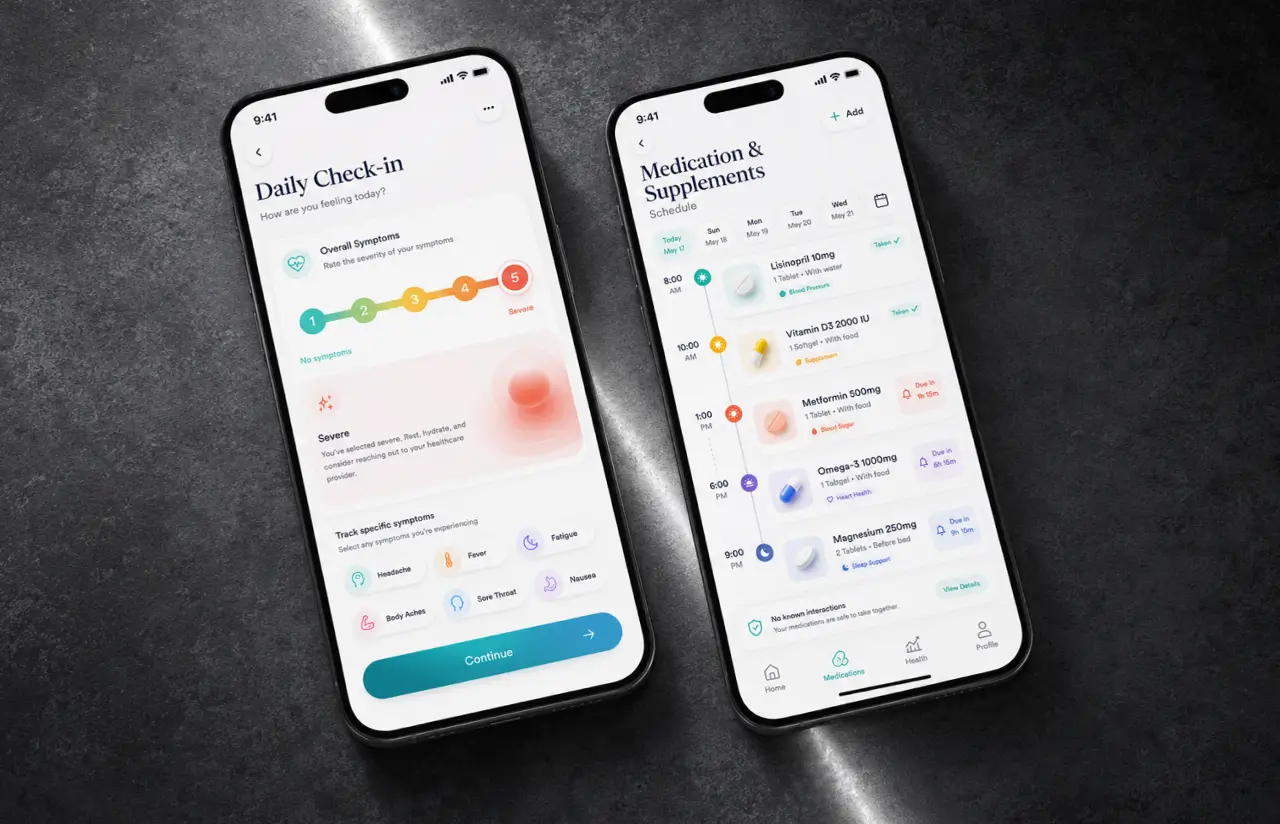
A check-in has to survive a bad morning. Early prototypes asked more than twenty questions about chronic symptoms, and completion fell below half, so the daily flow had to shrink to a handful of taps without losing symptom severity detail.

Unified Health Data Across Conditions and Treatments
Symptoms, medication doses, sleep quality, and triggers were captured in three separate shapes. With no single data model underneath, no chart could show whether a treatment worked or whether other factors caused the flare.

Health-Tech Security and Community Balance
Patients wanted peer support and full control over what they share. Data security expectations around health data and an open community feed pull against each other, and both had to ship in version one.
Technologies and Health Data Behind the Chronic Illness Tracker


Our Chronic Illness Tracking Solution
One question shaped the architecture: what does a patient have the energy to do on a bad day? The daily check-in became the spine of the symptom tracker. Charts, weekly reports, and community posts all read from that one stream of patient symptom data.
The check-in adapts to history. It surfaces the conditions and symptoms you logged yesterday first, so someone managing four chronic conditions never scrolls through a catalog of three hundred entries. Adding a symptom takes a tap. Symptoms stay on the list until you remove them, and the app remembers the ones you keep skipping.
Node.js runs the API and keeps web and mobile in sync, while Python services aggregate check-ins into rolling averages and lay medications, supplements, and triggers over the same timeline. That is where symptom tracking stops being a diary and starts answering questions people can understand. Did the B12 supplement move anything? Does alcohol show up the day before a flare? Tracking regular medication and meal schedules on that same timeline can also reduce flare-ups. React Native gave the team one cross-platform codebase for iOS and Android, with a React.js web app on the same API.
Offline mattered more than it sounds. Flares do not wait for signal, so the app queues check-ins on the device and syncs when the connection returns. Health data written offline reaches the server in the same shape it would have taken online, which keeps the weekly reports honest and gives healthcare providers clear documentation to understand the daily impact of chronic illness.
Daily Symptom Check-ins
One screen asks how active each condition was today, scored on a five-step color scale that works like a traffic light system for symptom stability and urgency. Patients can quickly track symptoms, medication doses, and health factors such as sleep quality, stress, and body temperature. The mood tracker rides in the same screen. Median check-in time in the app is 45 seconds.
Visual Health Histories and Weekly Reports
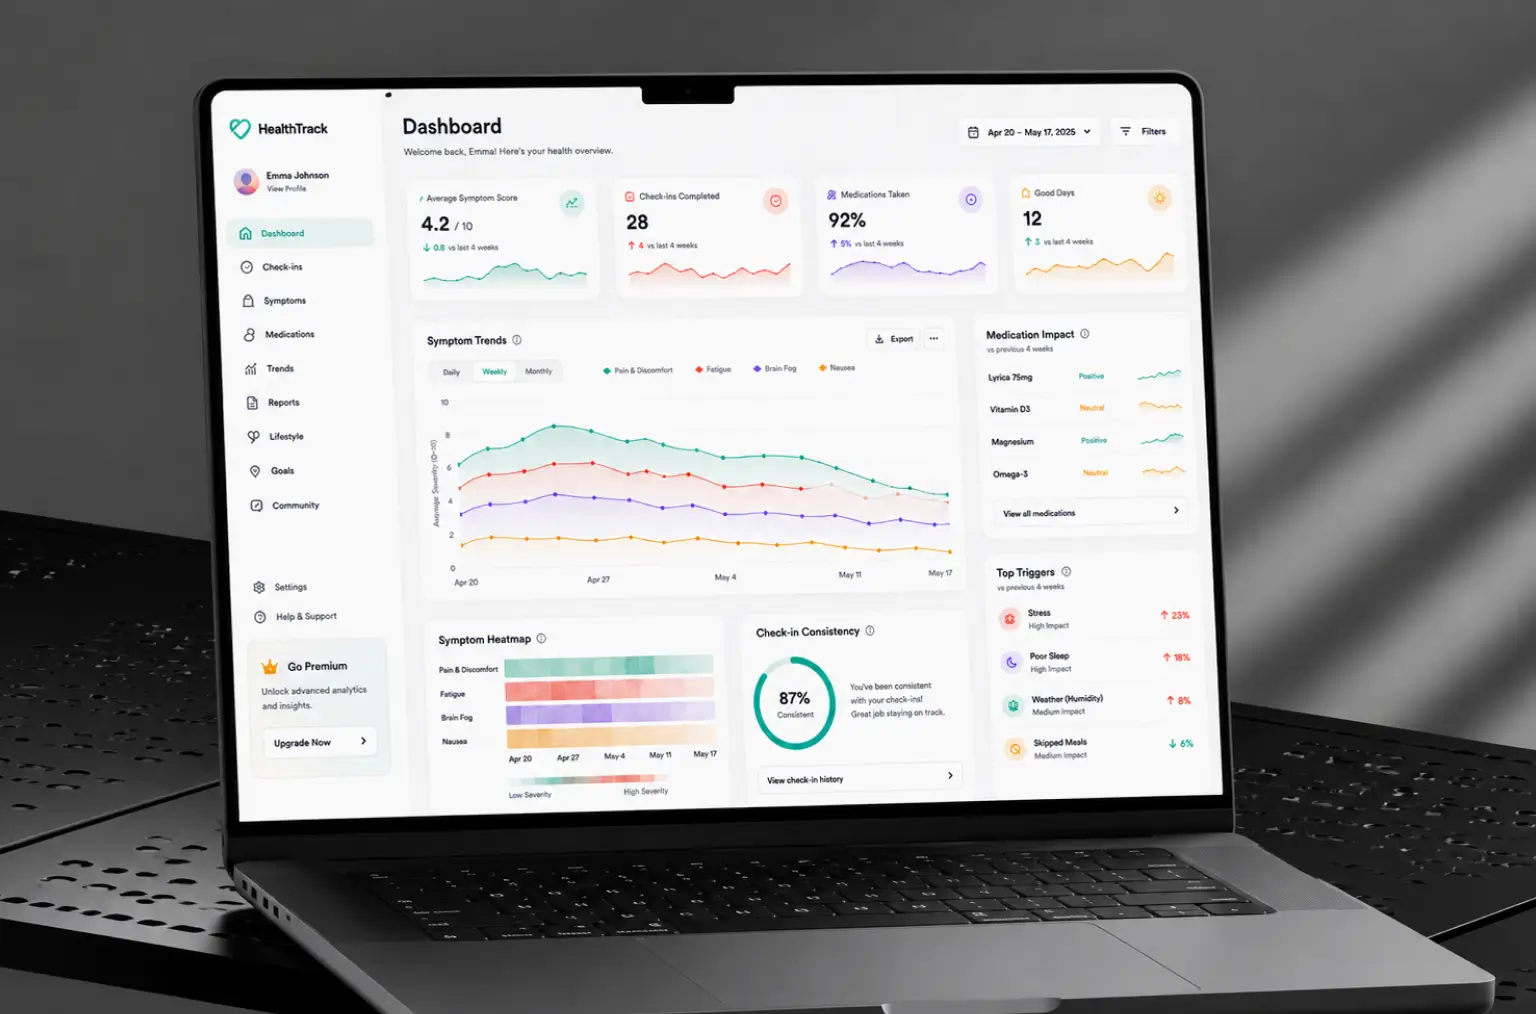
Every check-in feeds a visual health history: one color-coded row per condition, weeks running left to right. Weekly reports roll up symptoms, medication changes, and the share of days spent in remission, then land in the inbox each Sunday.
Treatment, Medication Management, and Trigger Tracking
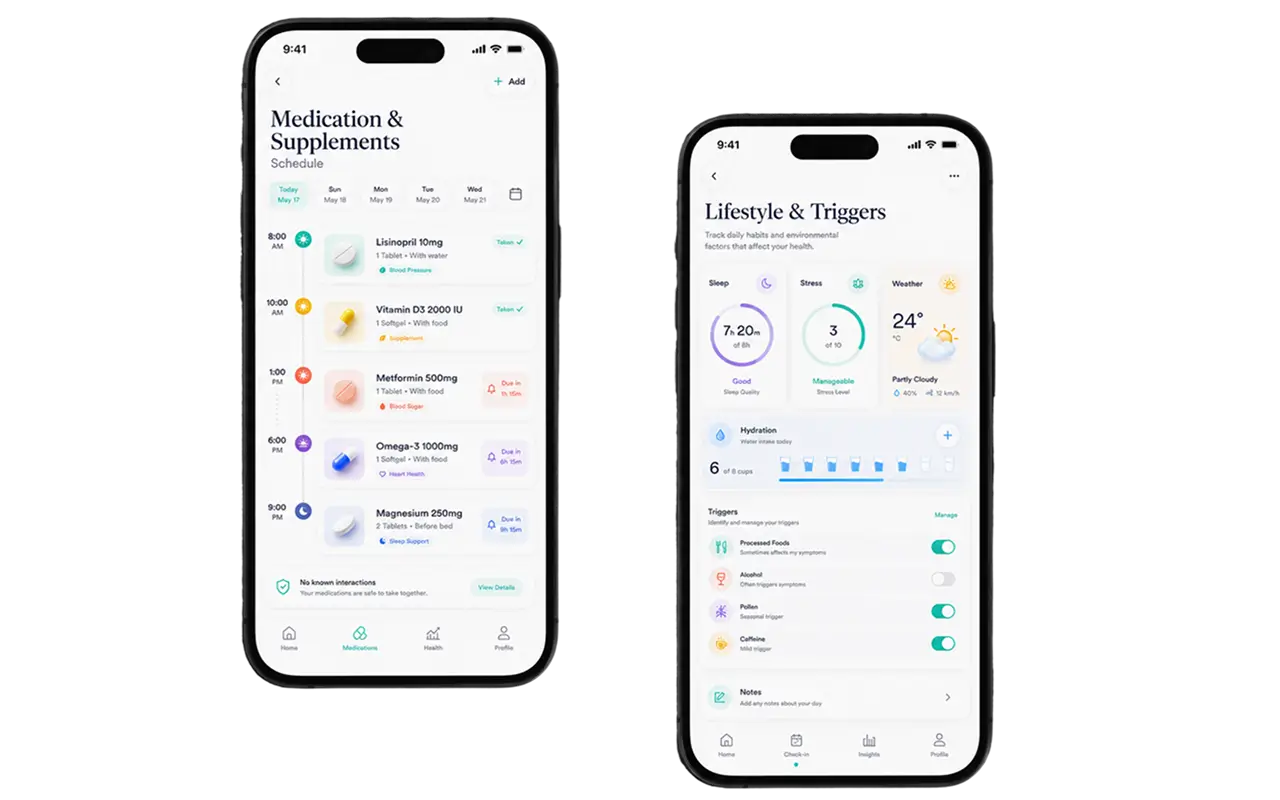
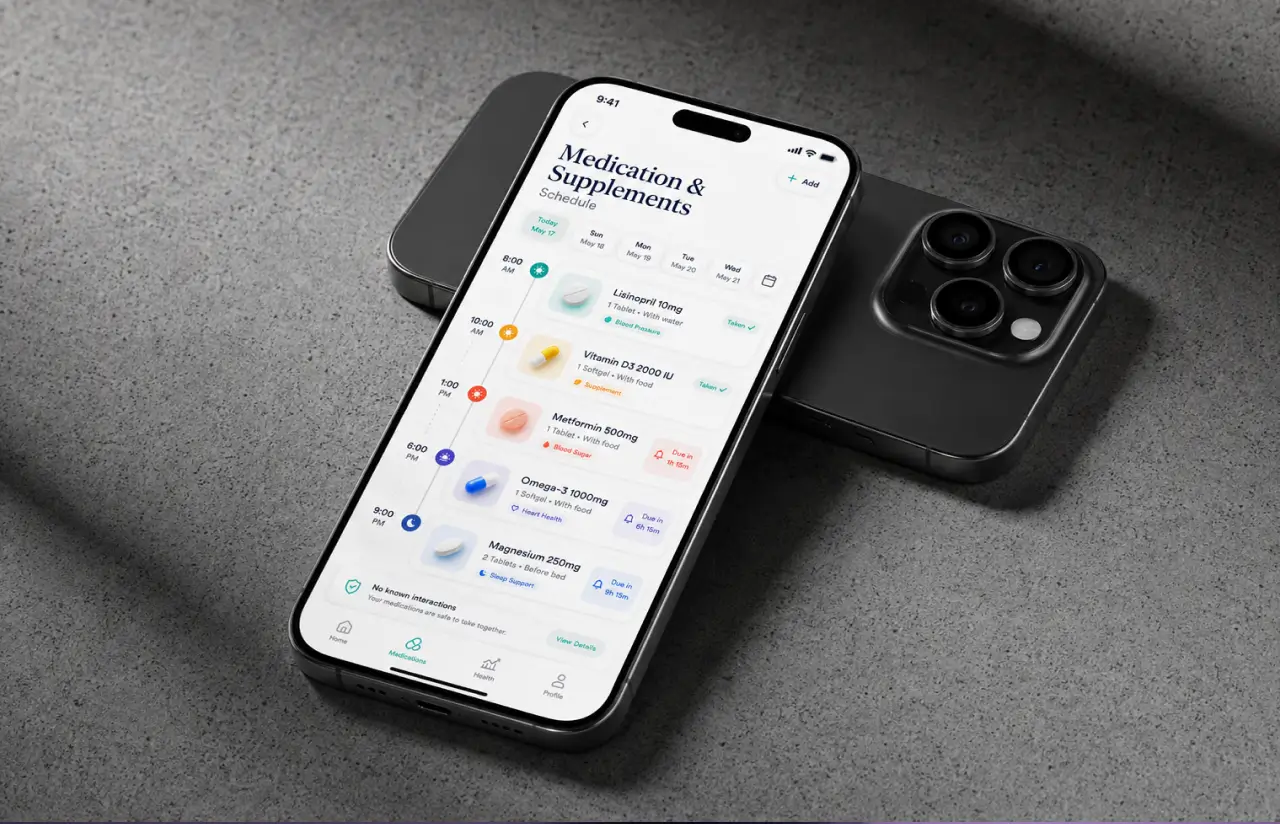
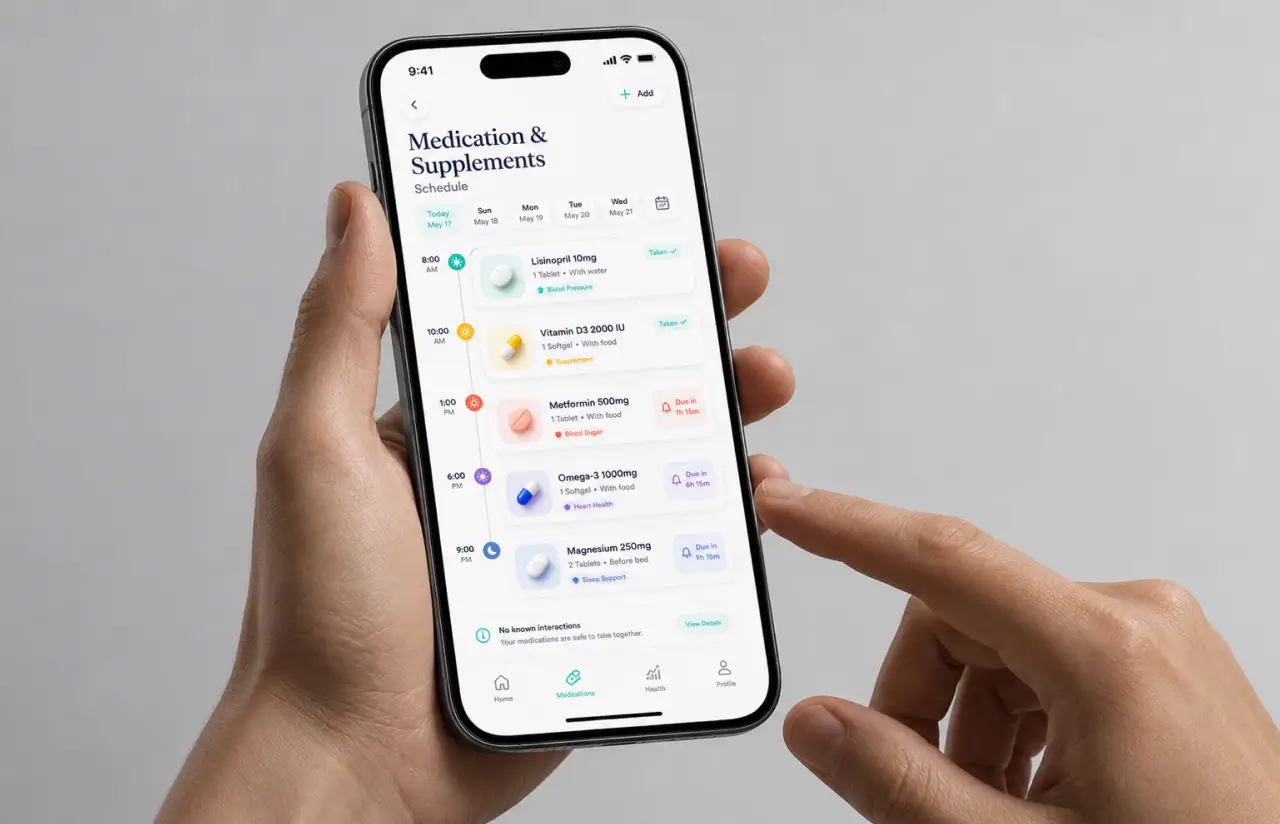
Medication management covers dose, schedule, and stop dates, with optional medication reminders, real-time medication reminders, and drug interaction warnings. Inside the app, patients plot medications and triggers against daily symptoms, then group them into patterns to test how those factors interact and whether a drug or a lifestyle change actually helps.
Shareable Reports for Healthcare Providers
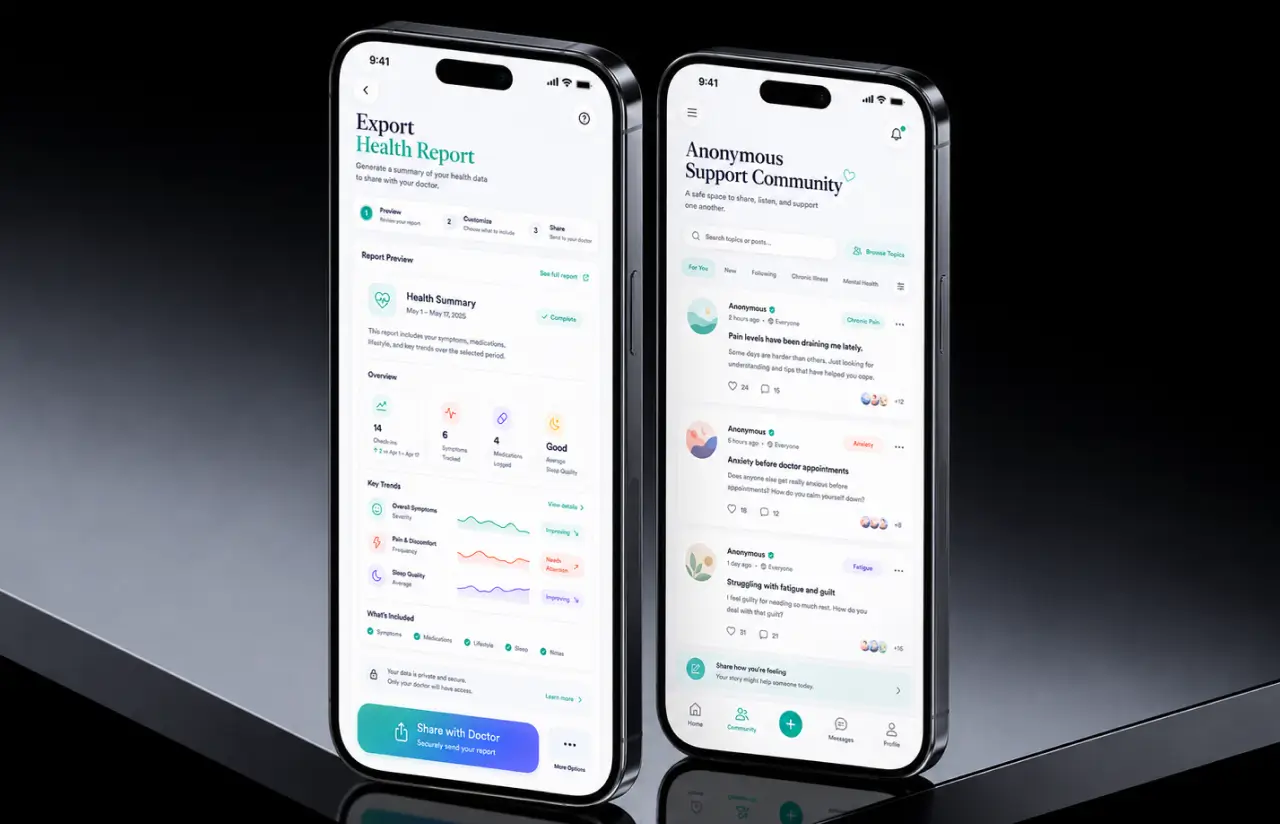
A two-page summary reaches the care team before doctor visits: symptoms over time, medication history, and test results the patient adds by hand. Users export data as CSV or PDF and choose exactly what leaves the app.
Community Support
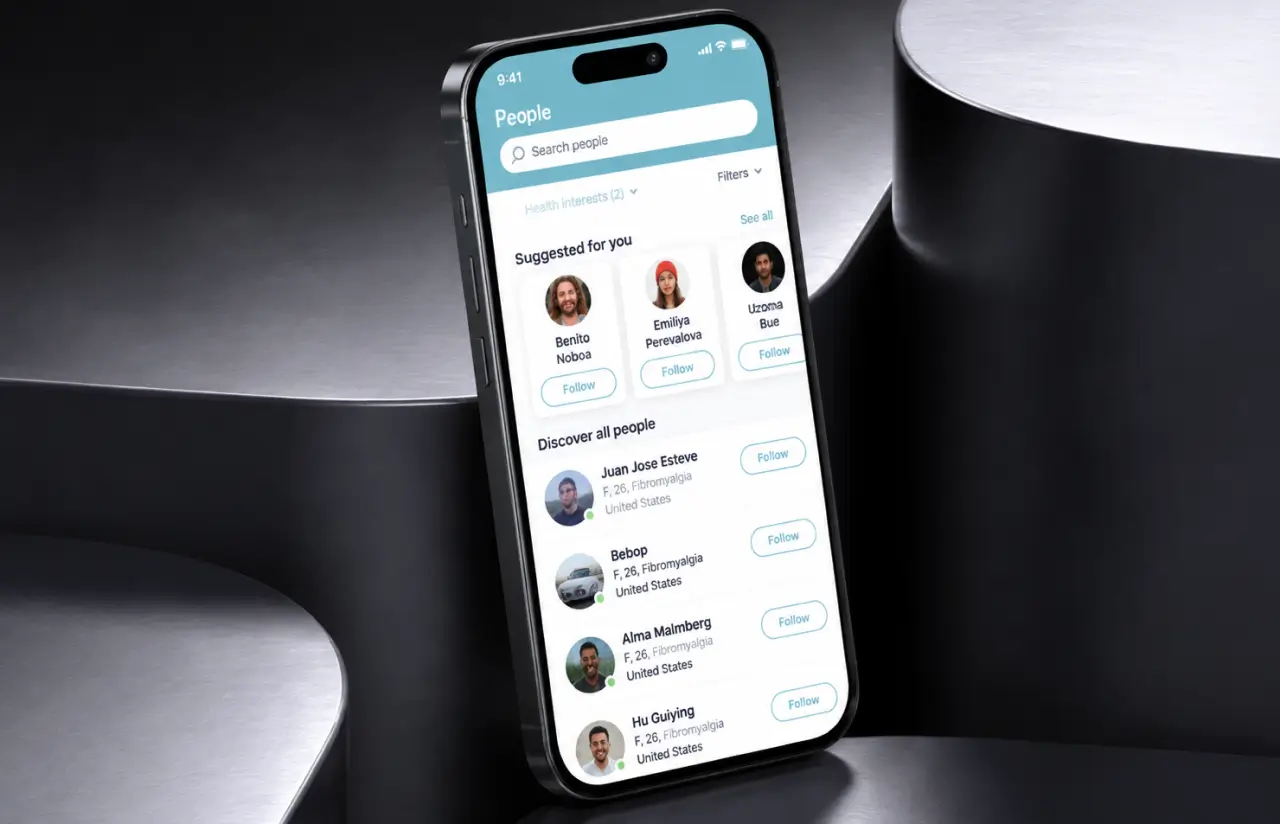
An in-app feed lets patients follow topics such as chronic pain, fibromyalgia, or digestive distress and post under a pseudonym. Tags and reactions keep threads searchable for the next person asking the same question.
Data Privacy by Design
Health data stays scoped to the account. We collect information only when a user types it in. Sharing is opt-in per report, community posts carry no medical ID or clinical profile, and we do not sell personal data or send it to a third party without a deliberate action.
Scrum Methodology
Project Journey
The first three sprints went into the check-in flow alone, because testers kept abandoning the symptom tracker after logging two or three symptoms. Web shipped first, then iOS, then Android, which let the team prove the data model once instead of three times. QA ran about 450 regression cases per release across 40 device and OS combinations, with two engineers on it full time. Crash-free sessions held above 99.4% through the first year of symptom tracking in production.
How the Chronic Illness Tracker Works
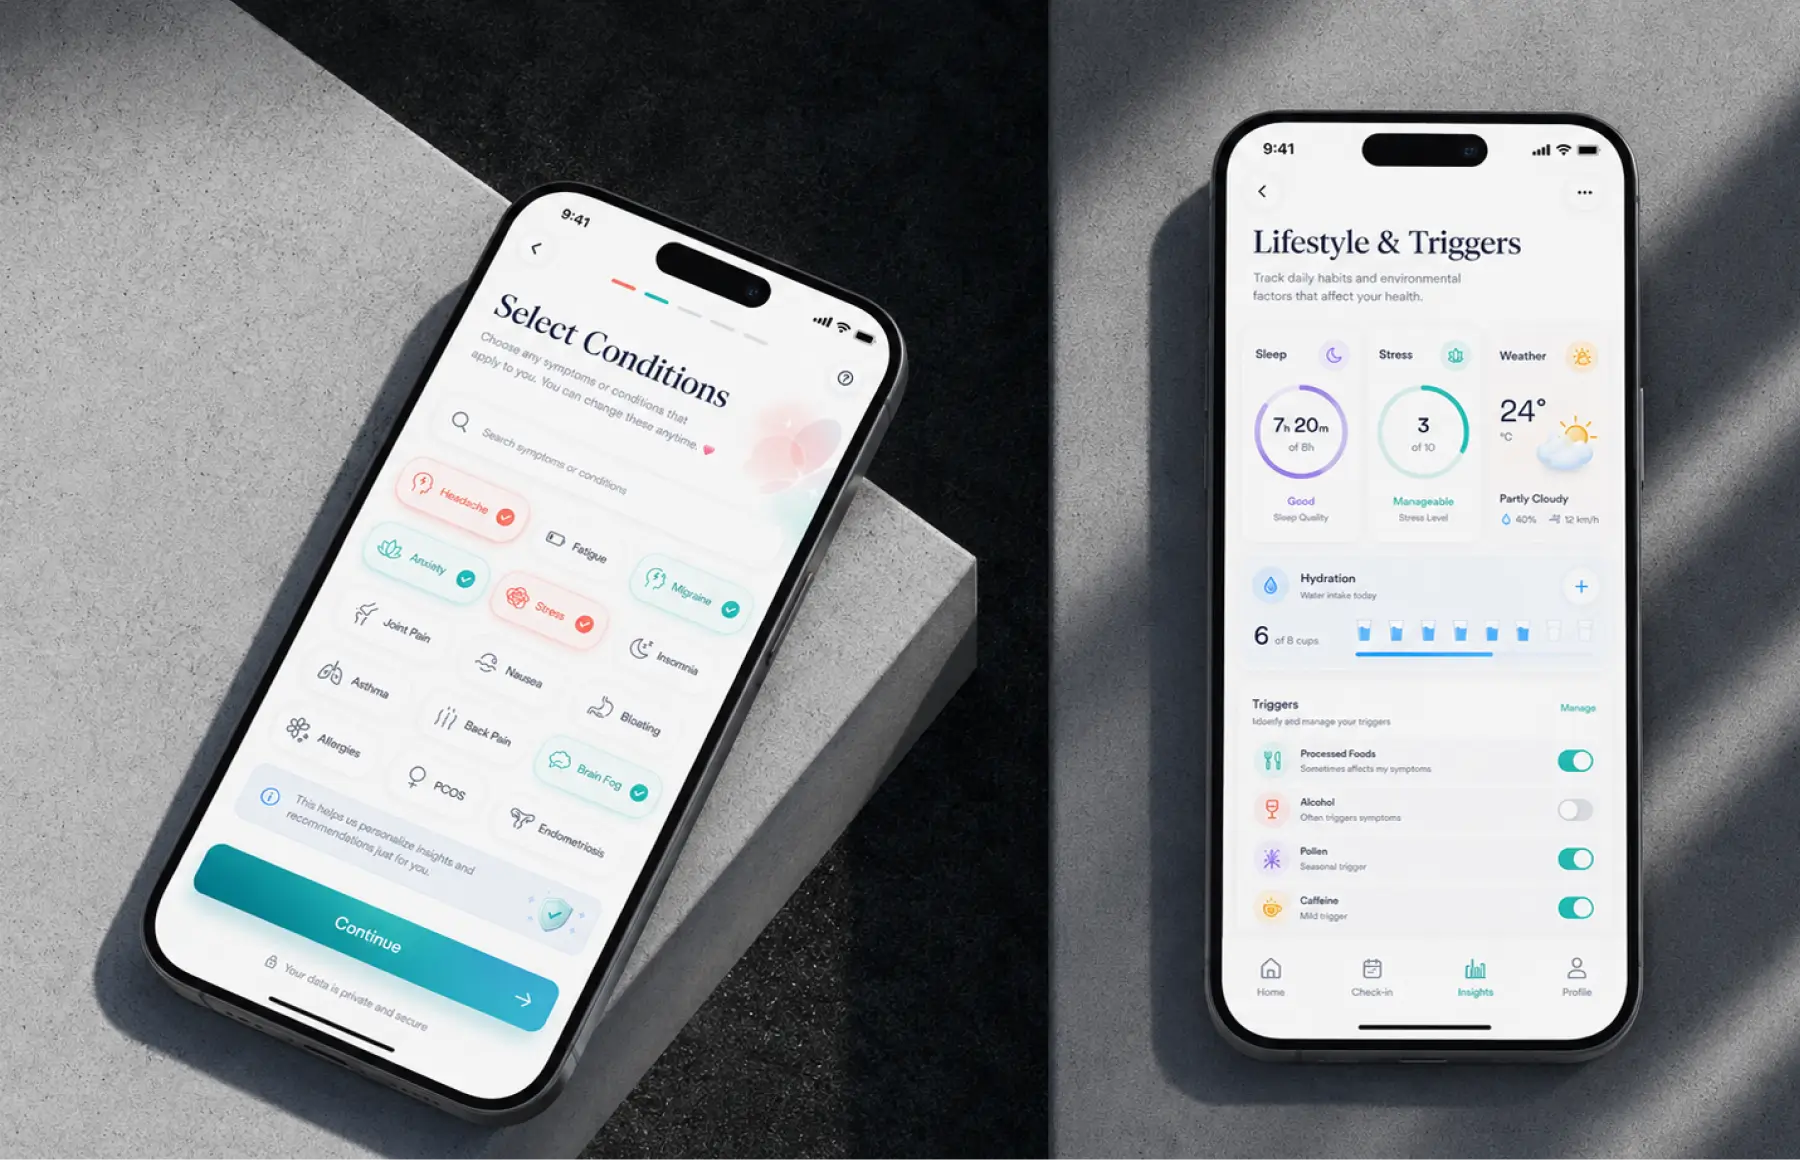
- Sign up on web or mobile, then pick the health conditions you live with, plus the symptoms that come with them, from a searchable list.
- A daily prompt asks how active each condition was. Rate the symptoms, add new ones, and the app is done with you in under a minute.
- Record medications, doses, supplements, and the health factors that might be driving a flare: sleep, stress, weather, diet.
- Charts stack conditions, symptoms, and medications on one timeline, so shifts in pain and symptom severity show up week over week.
- Generate a weekly report or export data, then send it to your doctor a day before the appointment.
- Post a question, follow a topic, and read what worked for people logging the same symptoms.
Scrum process flow
A chronic illness tracking app lives or dies on small interaction details, and those only surface once real patients use a build. Sprint demos put the symptom tracker in front of the client test group every two weeks, so the check-in flow was reworked three times before launch instead of after it. Our mobile app development team kept web and mobile inside the same sprint cadence, which stopped the two platforms from drifting apart.
How we delivered the symptom tracker project
- We define the project goal together, agree on priority features, and set a realistic delivery date and budget.
- We build a ranked list of everything the app needs, starting with what matters most to the business.
- Work is broken into 2-week cycles. At the start of each, we select the next set of features to deliver.
- The team builds, tests, and integrates features throughout the sprint.
- At the end of every sprint, you see working software and give feedback that shapes the next cycle.
- Each sprint produces a shippable piece of the app. We review what worked, adjust, and move forward.
Timeline
Five phases, clearly defined
Discovery & Product Workshop
- Mapping 300 preset conditions, 12 health factors, and 4 treatment types
- Agreeing what counts as a condition, a symptom, and a trigger
- Interviewing patients who live with three or more chronic conditions
UX Prototyping
- Testing six versions of the check-in grid with real patients
- Setting the five-step severity scale and the color per condition
- Wireframing the charts, journal, and community tabs before any code
Agile Development
- Shipping web first, then iOS, then Android on one shared API
- Building the offline queue, weekly report engine, and CSV or PDF export
- Replacing the long condition picker with search in sprint 9
QA & Testing
- Running about 450 regression cases per release
- Testing across 40 device and OS combinations, iOS and Android
- Auditing sharing rules, opt-in flows, and every path that touches health data
Launch & Support
- Publishing to the App Store and Google Play, web app live in parallel
- Watching crash-free sessions weekly, held above 99.4%
- Adding features from community feedback, still on 2-week sprints
UI/UX Design: Patient-Centered Interface for Chronic Illness and Mental Health Management
Most chronic disease dashboards open with a wall of numbers. This app opens with color, and color carries most of the meaning. Each condition gets its own shade, teal for one, coral for another, and severity shows up as a filled square rather than a number, so a week of chronic pain reads in a glance instead of a paragraph. Our product design team tested six versions of that grid with real patients before the palette settled.
Testing with people who live with brain fog changed the navigation. It also had to work for users dealing with anxiety or low focus. Deep menus were the first thing to go. Any screen returns to the previous menu with a single tap, the four bottom tabs stay fixed in place, and destructive actions ask twice. Nothing in the daily app flow requires typing unless the user wants to add symptoms that are not on the list yet.
Performance sat in the design brief, not just the backlog. Charts covering two years of daily symptoms had to render at normal speed on a three-year-old Android handset, even when people review sleep cycle or hydration trends alongside symptoms, which capped animation and pushed aggregation back to the server. The symptom tracker had to stay user-friendly on the worst day of the month, and that constraint settled most of the arguments.
Results
Before
- ✕Symptoms written in a paper diary, or recalled at the appointment from memory
- ✕Medications, doses, and supplements kept in a separate notes app
- ✕No way to compare a treatment against pain and symptom severity over time
- ✕Doctor visits opening with ten minutes of guesswork about the past month
- ✕Patients with multiple chronic conditions had no single view of their own health data
- ✕Treatment decisions argued from memory, with no record of which medications had already failed
After
- ✔Daily check-in finished in under 45 seconds, median across active users
- ✔7,000+ active users, growing 10–15% per month after launch
- ✔Conditions, symptoms, medications, and triggers logged in one app
- ✔Weekly reports and a visual health history ready in the app before every appointment
- ✔Three platforms, web, iOS, and Android, on one shared health data model
- ✔Two years of symptoms and medications exportable for any new specialist
Impact of the Chronic Illness Tracker After Launch
Verified Reviews
Our Reputation on Top Platforms
Reviews from clients working on health conditions and wellness apps tend to mention the same two things: engineers who ask questions about the patients before writing code, and a QA process that catches the edge cases nobody wrote a ticket for.
Have a Health Tracking Project in Mind?
Need a chronic illness tracker, a symptom tracker, or a health tracking app for patients with complex health needs? Tell us who your users are, and which symptoms and health metrics matter to them. We reply within 48 hours with scope, an estimate, and the team.
Thank you for your message. It has been sent.