



Renewable Energy Software Development: Building a Solar Energy Management Web App
- 1,200+ PV sites monitored from one dashboard
- 60% less time spent on manual site checks
- 30 to 7 days shorter invoicing cycle
- 3 user roles, one shared platform
Solar installers and energy providers rarely see production, consumption, import, and export in one place. This renewable energy software development project gave a Swiss operator a single web dashboard for all four, with billing tied to the same meter data.
Request similar solution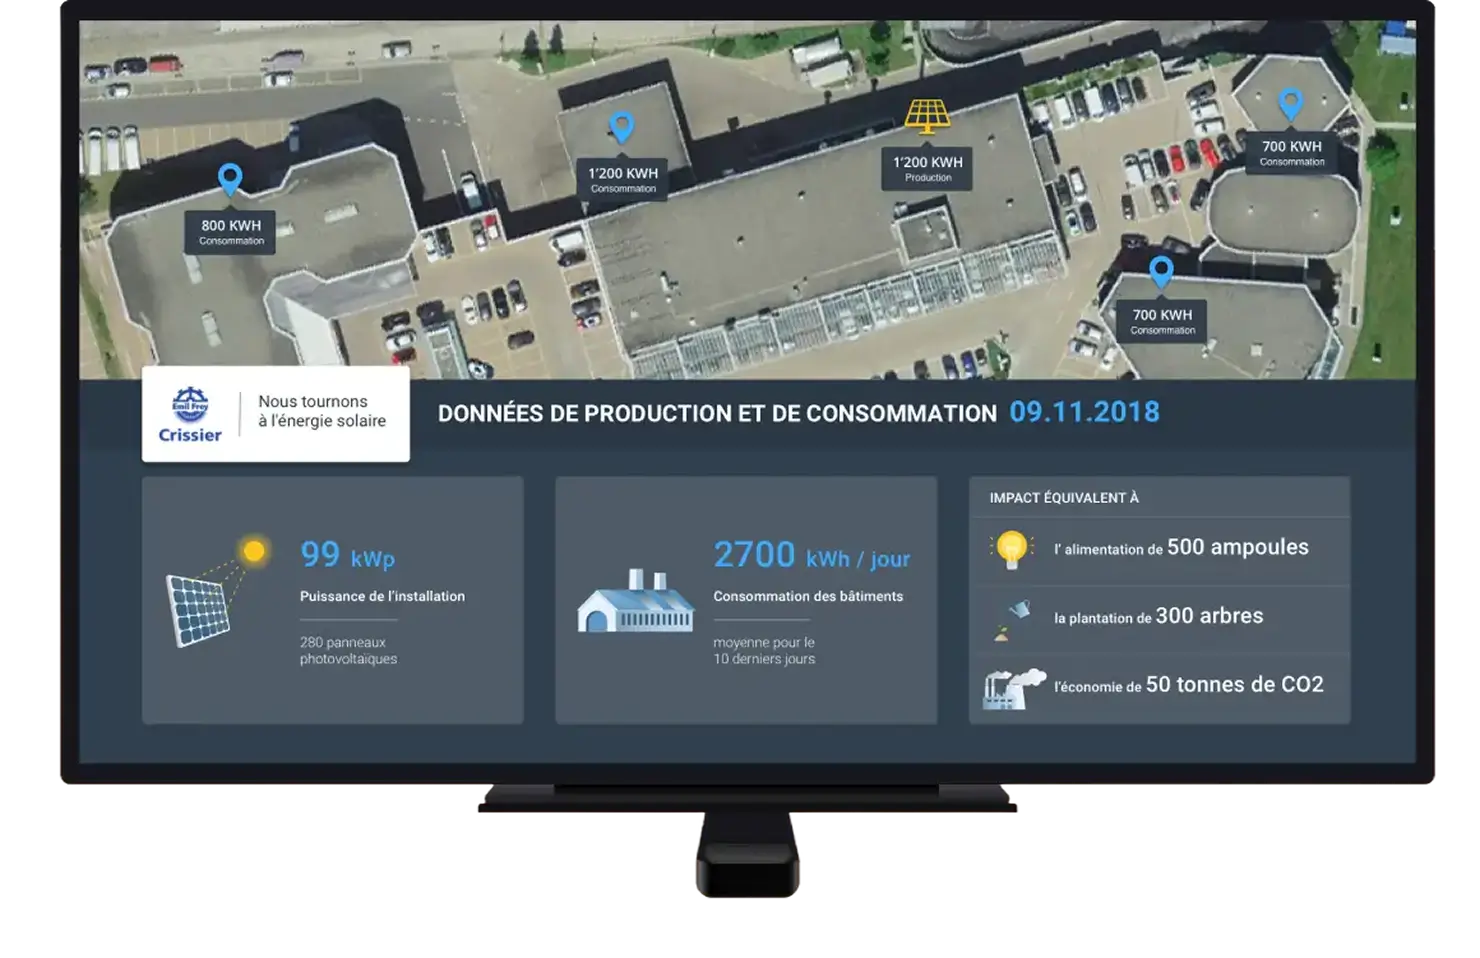
Project Details
The client is a European renewable energy operator that finances, installs, and runs rooftop solar for businesses, EPC contractors, and PV distributors. Their installers were logging into three vendor tools to learn what a single solar system was doing. For teams facing similar fragmentation, our cloud application development services help bring operational data and workflows into a shared platform.
 Client
- Younergy
 Industry
- Energy
 Solution
- AI-powered energy management and grid optimization platform
 Service
- Product Design + Software Development + Full Cycle QA + Publishing
 Platform
- Mobile (iOS, Android) and Web
 Scope
- Frontend, Backend, IoT Integration, AI/ML, QA, Design
 Duration
- 18+ months
 Location
- Switzerland
Business Challenge: Building a Comprehensive Solar Panel Monitoring App
Before the project, a site check meant driving out, or opening the inverter vendor’s portal, then the meter provider’s portal, then a spreadsheet for the tariff. The client ran roughly 300 sites this way and wanted to reach 1,000 without tripling the operations team. Discovery surfaced three problems that any real-time monitoring software for renewables has to solve. Wind operators run into the same three, even though this project covered rooftop solar only.
-

Real-Time Energy Analytics and Forecasting
Inverter data arrived in hourly batches. Nobody could tell whether a dip in output was cloud cover or a failed string. The client wanted five-minute readings and a forecast to compare against, so anomalies show up the same day and support calls drop. Without real-time data, predictive analytics were off the table.
-

Multi-Platform Energy Management
Installers work from a van, customers check their roof from a phone, and finance staff sit at a desk. One platform had to serve all three roles effectively without three codebases or three sets of permissions. Building software for three audiences meant one account model from the start.
-

Smart Grid Integration and Compliance
Swiss distribution operators require export data in fixed formats before a site can feed the grid. Manual reports took about a day per site. Regulatory compliance had to become a button rather than a project, and the same compliance requirements will apply to battery storage and other energy storage once it joins the grid.
Technologies Behind the Renewable Energy Software Platform






Our Solar Energy Management Solution
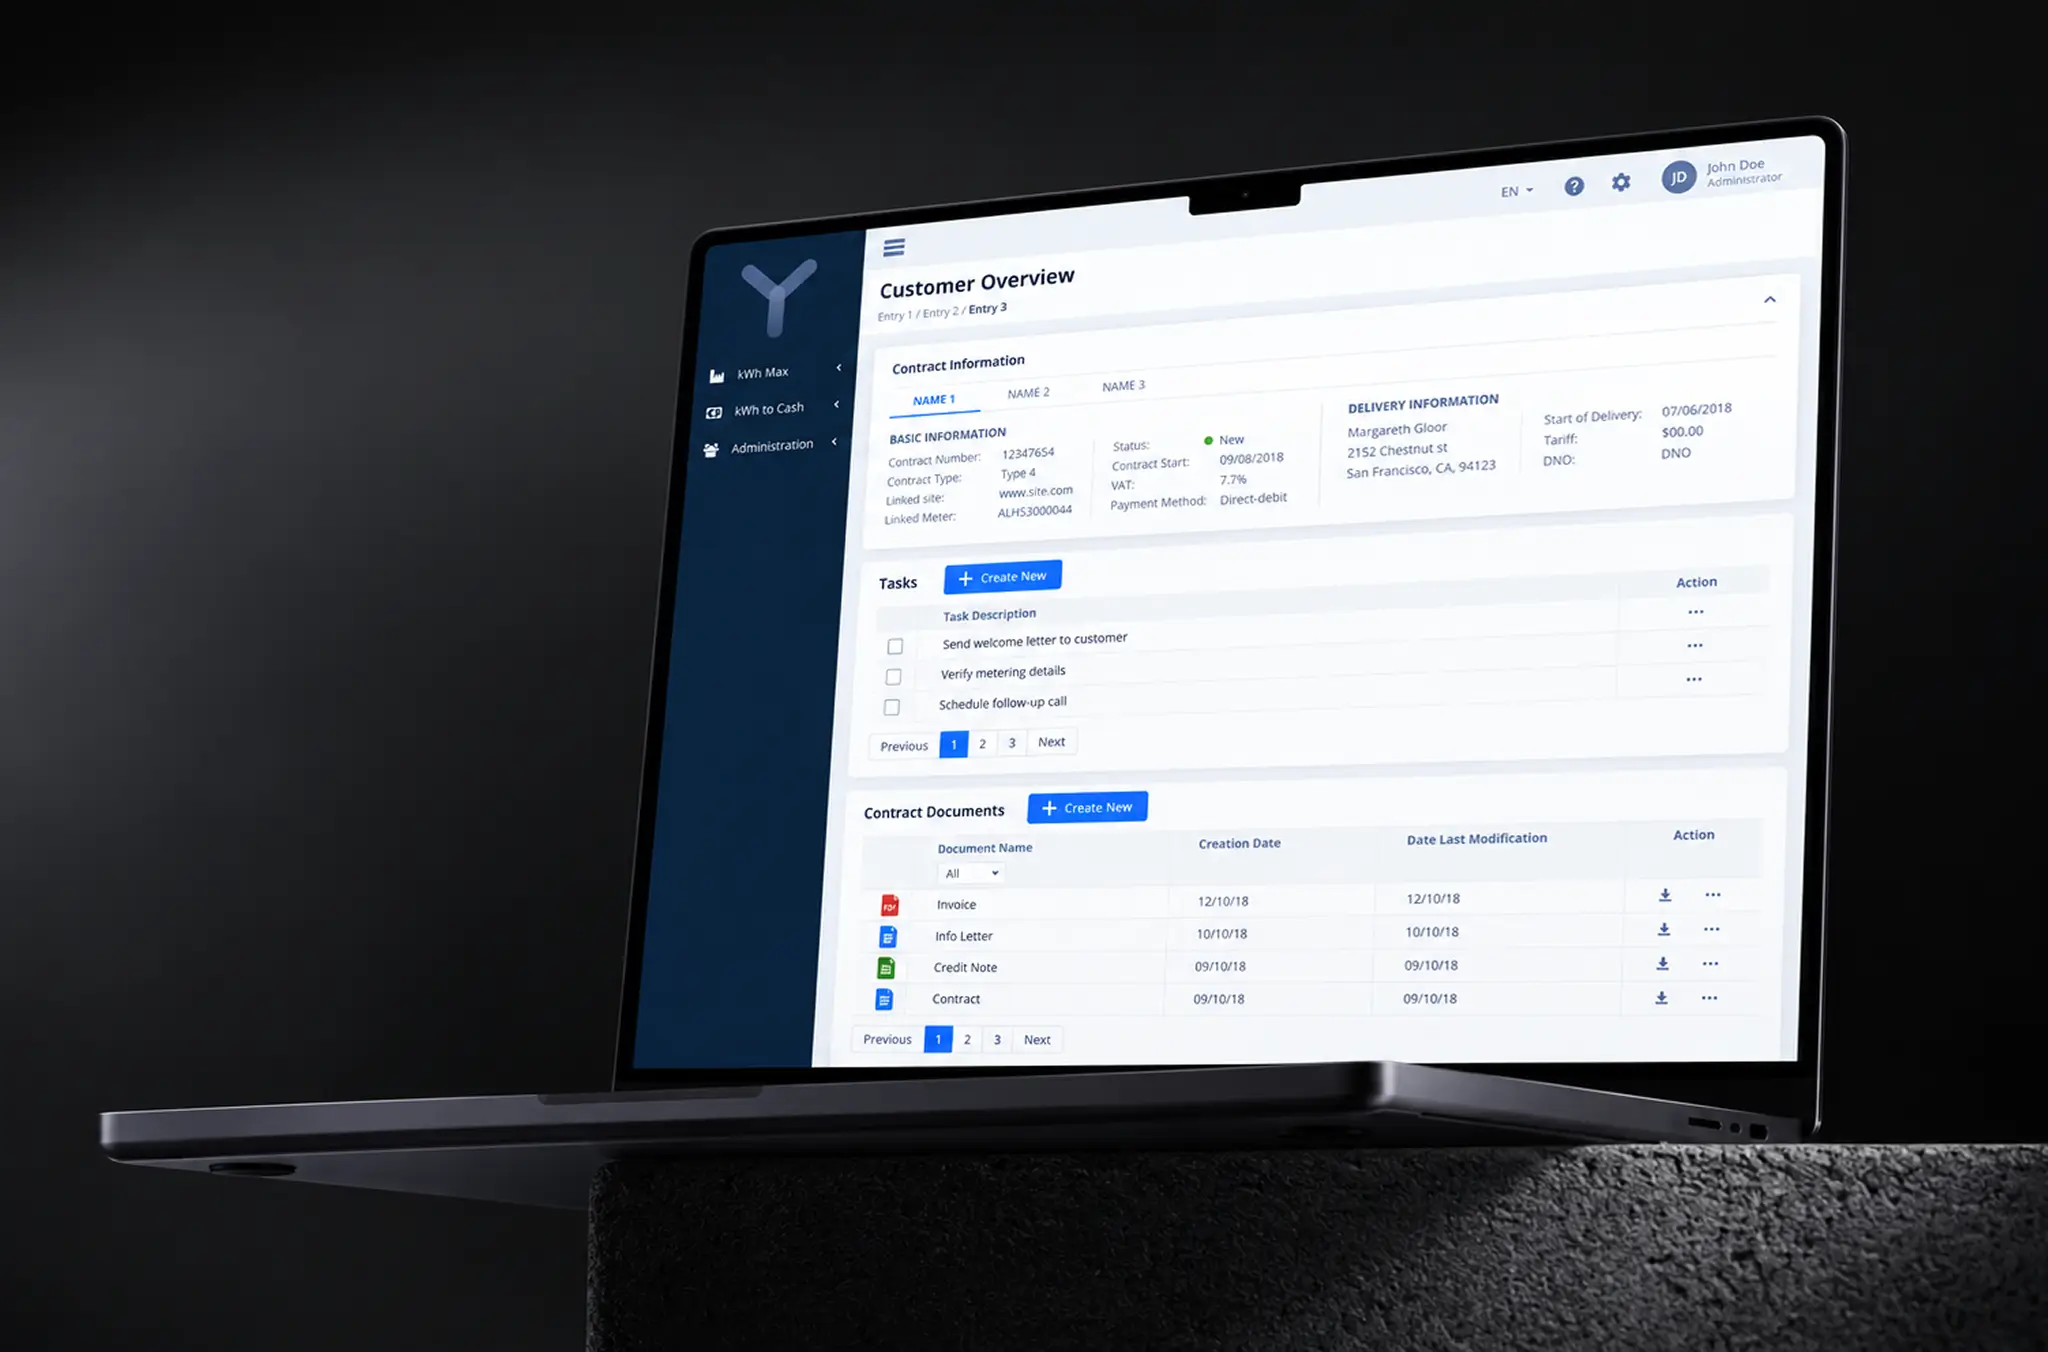
The platform is split into two modules that the client named themselves: kWh Max for monitoring and kWh to Cash for money. The first module answers what every roof is doing right now. The second turns those readings into tariffs, invoices, collections, and receivables, so the operator never re-keys a number between systems. That alone cut costs in the back office by roughly a fifth, most of it staff hours.
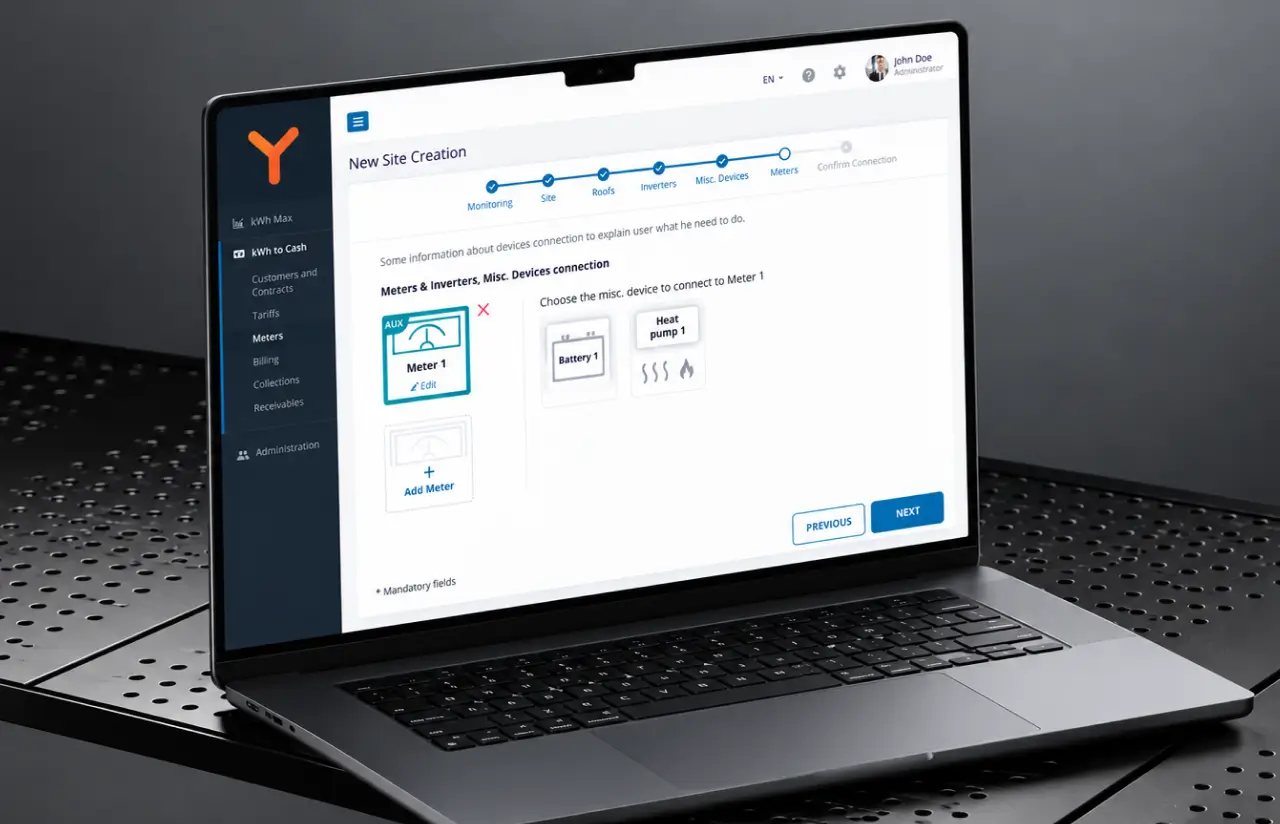
A new site enters through a seven-step wizard: monitoring setup, site details, roofs, inverters, misc. devices, meters, and device connections. An installer drags modules onto MPP trackers on screen, and the platform estimates annual production per roof before a single reading arrives. Onboarding a site dropped from around two days of back-and-forth between engineers and installers to under an hour.
This is custom energy software development rather than a dashboard skin on a vendor API, and the custom software design shows in how the solution ages. Every device type, tariff rule, and report format lives in configuration, which is why the client could add a fourth inverter brand in sprint 22 without a new release.
-
AI-Powered Energy Forecasting
A Python model trained on about 14 months of site history predicts next-day production per roof. Actual output is plotted against the forecast, and a gap wider than 15% opens an installer ticket. Predictive maintenance starts from that ticket, and the same model feeds the energy production forecast on the customer dashboard.
-
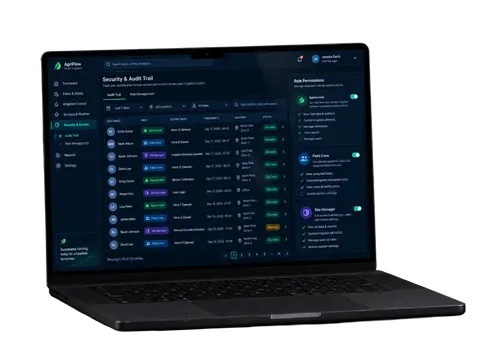
Comprehensive Energy Management Dashboard
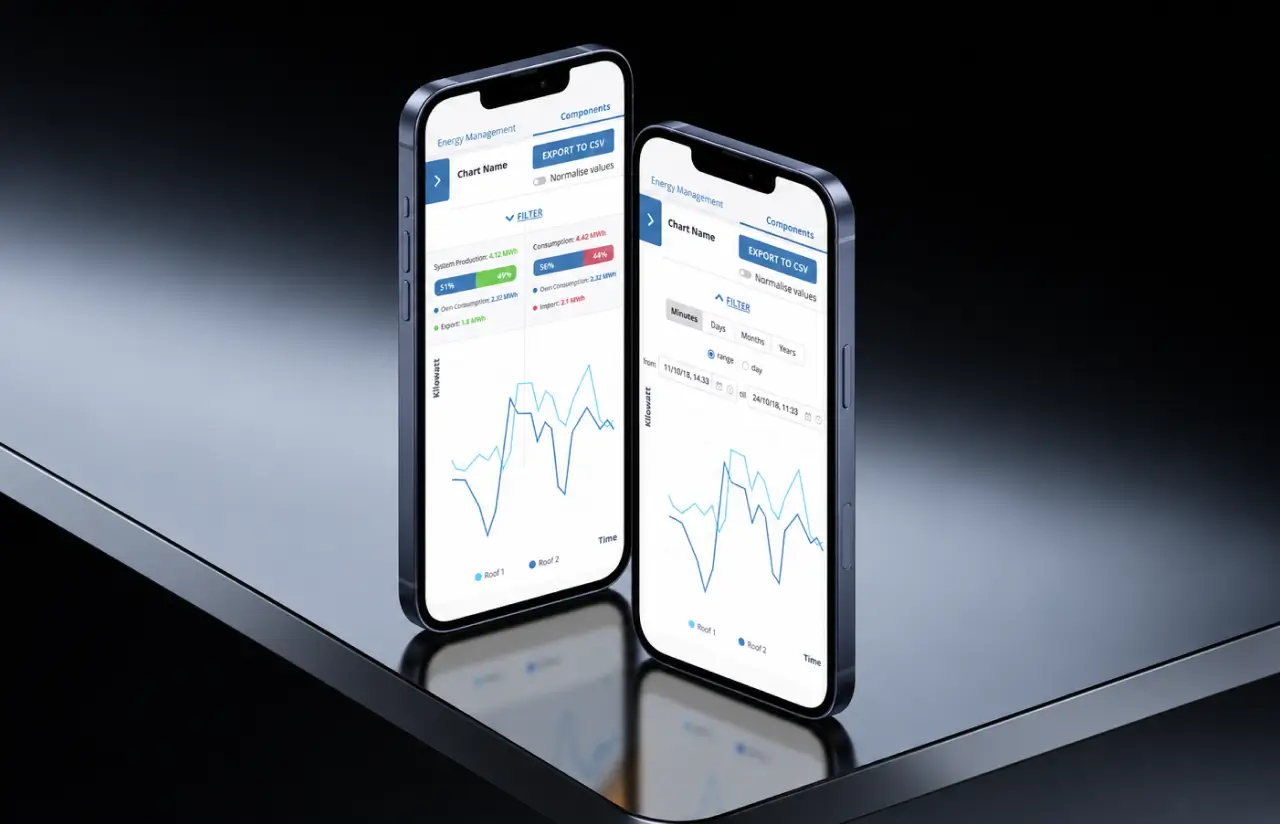
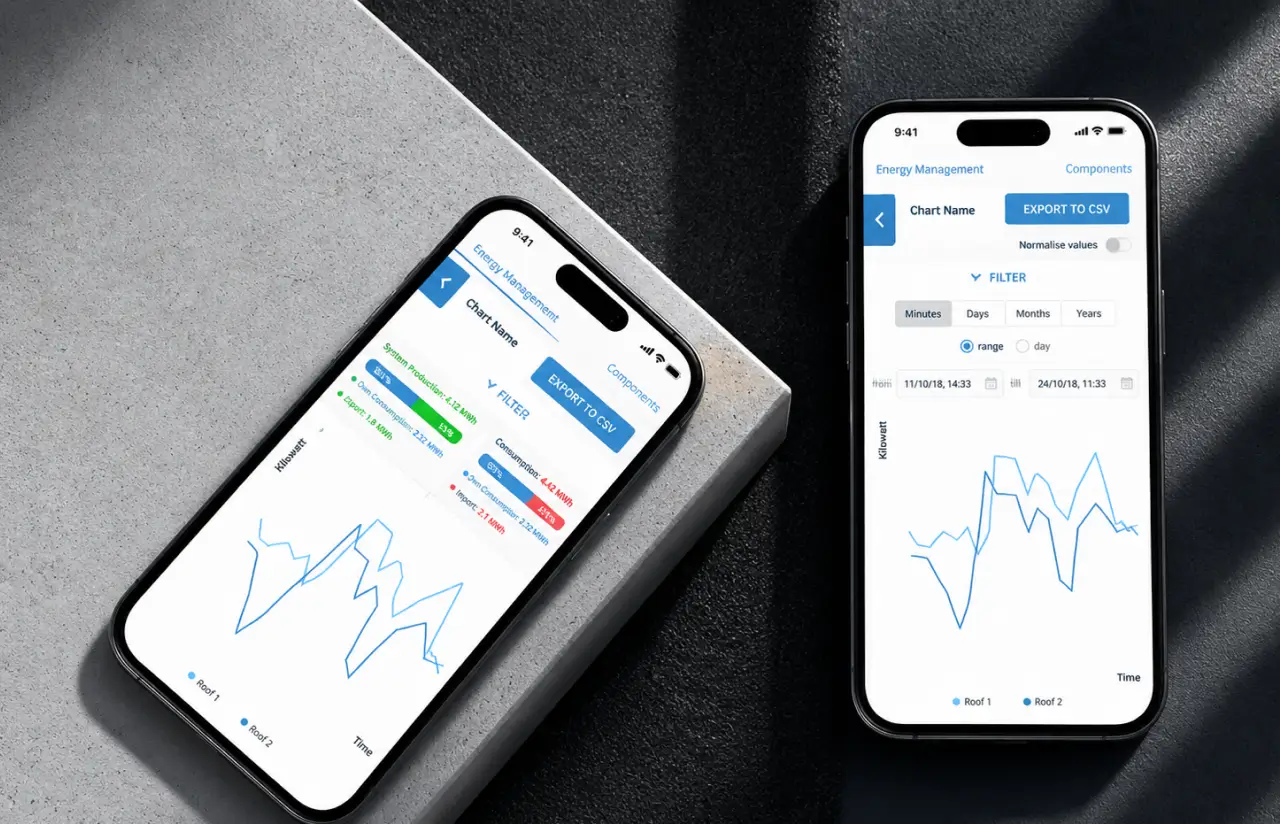
One screen shows generation, own consumption, import, and export for a single site or the whole portfolio, switchable between minutes, days, months, and years. Values can be normalized per kWp, and every chart exports to CSV in one click.
-
Smart Grid Integration Platform
Meters and inverters connect over Modbus TCP and IEC 61850. OpenADR handles demand-response events from the grid operator. Adding a device type means editing a config file, so the integration layer keeps up with new hardware.
-
Energy Optimization Recommendations
The platform flags sites where self-consumption drops below 45% and suggests battery storage or load shifting. Operators see projected savings in CHF before they call the customer, which makes the upsell conversation short.
-
Multi-Stakeholder Energy Platform
Three roles share one login system: administrators, installers, and end customers. Customers see their roof, gauges, and invoices. An installer sees every site they service. Admins see the tariffs and receivables behind it all.
-
Security-First Energy Data Management
Meter readings feed invoices, so each value is signed at ingestion and stored in an append-only log. The API enforces role permissions, not just the UI. Every tariff change leaves an audit trail with the editor's name.
Need a solar management system for your installer network?
Request a Similar SolutionScrum Methodology
Project Journey
Eight people worked on project development: a software engineer on the device layer, three front-end developers, a designer, two QA specialists, and a project manager. Work ran in two-week sprints with a demo at the end of each one. The first four sprints were spent on the device layer alone, because nothing else mattered if readings were late or wrong. Solar systems went live in waves from sprint 12 onward, which let the client’s own installers report bugs against real roofs instead of test data. This combination of device integration, application delivery, and field testing reflects our approach to custom software development.
- Weeks sprint cycles
- 2
- Sprints completed
- 36+
- of sprints delivered on schedule
- 94%
- Team members
- 8
How the Solar Energy Management System Works
-
Installer creates a site in the wizard
Site address, roofs, and orientation go in first. The map picker fills in coordinates. The platform estimates yearly kWh per roof from module count and tilt.
-
Devices connect over Modbus and IEC 61850
Each inverter and meter is registered with its protocol and address. A connection test runs before the site is saved, so dead links never reach the dashboard.
-
Readings land every five minutes
Node.js workers poll devices, sign each value, and write it to PostgreSQL. Gaps longer than 15 minutes raise an alert to the installer on duty.
-
Dashboard shows the full energy balance
Generation, own consumption, import, and export appear as lines and as percentage bars. Roof 1 and Roof 2 can be compared on the same chart.
-
Forecast flags underperforming roofs
The model predicts tomorrow's output. When actual output trails the forecast by more than 15%, a ticket opens with the roof, the gap, and the last clean reading.
-
Meter data becomes an invoice
Tariffs in kWh to Cash apply to the same readings. Invoices generate on the seventh day of the month, and collections track who has paid.
Scrum Process Flow
Every sprint on this project ended with a demo on live site data, which is how the client caught that installers read percentages faster than kWh totals. Our web development team re-planned the next sprint around percentage bars for own consumption and export. Two of the 36 sprints slipped, both because a meter vendor changed its firmware mid-sprint.
Inside Each Sprint
-
Daily Scrum
15-min sync every morning
-
Retrospective
Inspect & adapt process
-
Sprint Review
Demo to stakeholders
-
Increment
Shippable product update
How We Delivered the Solar Management Software Project
-
Scope & Timeline
We define the project goal together, agree on priority features, and set a realistic delivery date and budget.
-
Feature Priorities
We build a ranked list of everything the product needs, starting with what matters most to the business.
-
Sprint Kickoff
Work is broken into 2-week cycles. At the start of each, we select the next set of features to deliver.
-
Development Cycle
The team builds, tests, and integrates features throughout the sprint.
-
Review & Feedback
At the end of every sprint, you see working software and give feedback that shapes the next cycle.
-
Delivery
Each sprint produces a shippable piece of the product. We review what worked, adjust, and move forward.
UI/UX Design: Intuitive Interface for Renewable Energy Management Platform
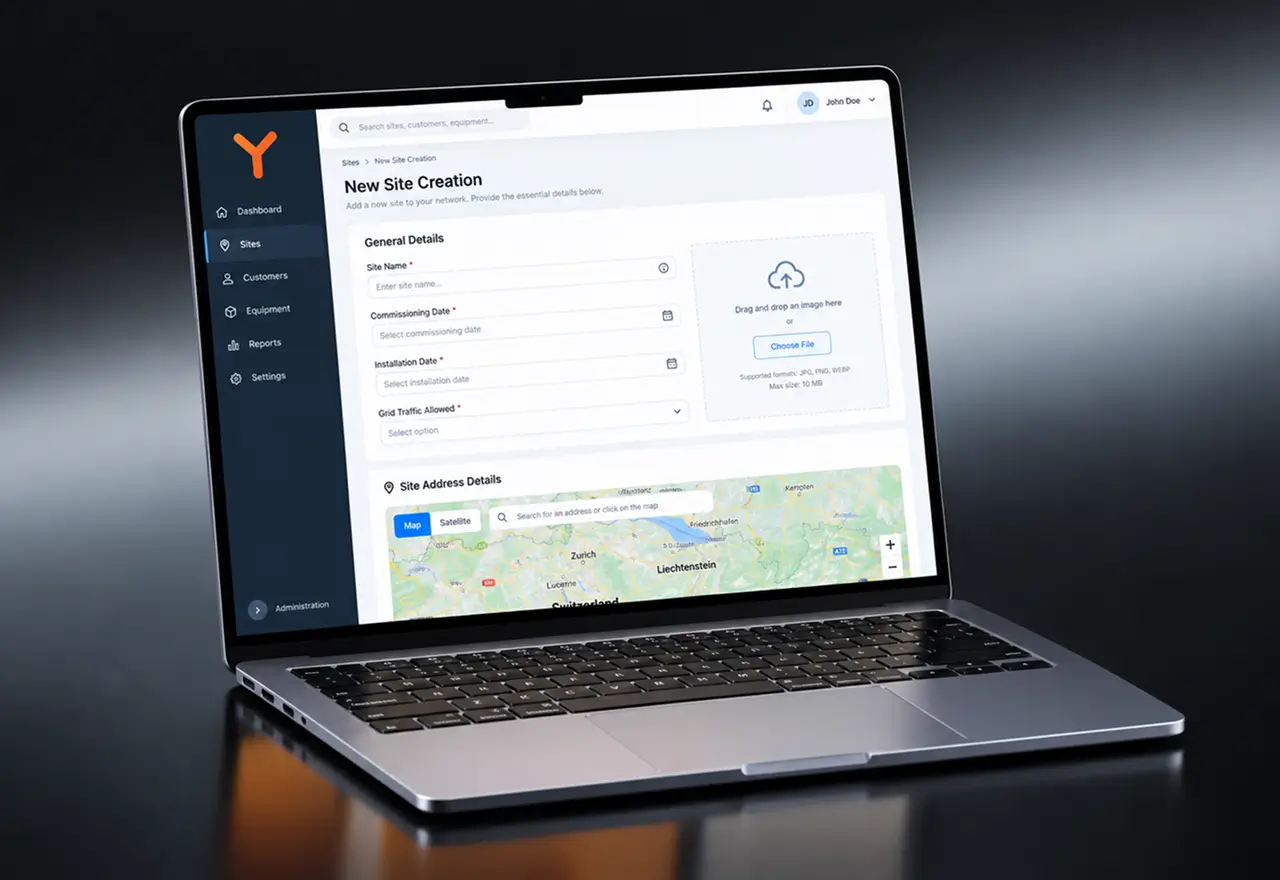
Our product design team started from the installer’s van, not from a style guide. The left rail holds three items only: kWh Max, kWh to Cash, and Administration. Everything an installer touches in the field sits under the first one, and the stepper across the top of the site wizard shows which of the seven steps is done. Blue #3DACFF marks the active step and the primary button. Grey #8591AA and dark purple #3F4163 carry the rest.
Charts were the hardest part. Early versions plotted kWh totals, and installers kept asking what the number meant. The final design shows own consumption versus export as a split percentage bar (51% / 49% on a typical day) above the line chart, with a range or single-day toggle underneath. The same layout collapses to a phone screen with the filter panel folded away. Explore our water management software case study for another example of using household sensor data to explain consumption patterns.
User testing revealed two extra surfaces. Customers got a gauge view of performance, autonomy, and self-sufficiency with environmental gains in trees and kilograms of CO2, which the client now reuses in its sustainability reporting. Building owners got a public display mode for lobbies: a satellite view of the roof with live production pins, kWp installed, and a ten-day consumption average. One site in Crissier runs it on a screen by the entrance.
Results
Before
- 3 vendor portals opened per site check, plus a tariff spreadsheet
- Hourly data, so faults were found days later
- ~300 sites run by an operations team of 6
- Invoices sent about 30 days after month-end, ~12% disputed
- Grid export reports built by hand, about a day per site
After
- One dashboard for generation, consumption, import, and export
- 5-minute readings, faults flagged within the hour
- 1,200+ sites on the same six-person team
- Invoices in 7 days, disputes under 3%
- Export reports generated automatically in the operator's format
Impact of the Renewable Energy Software Platform After Launch
The operator quadrupled its site count without adding headcount, which is where the margin came from. Invoicing that lands in a week instead of a month pulled roughly three weeks of receivables forward, and the drop in disputed invoices freed the finance lead from about two days of reconciliation each month. Resources that used to go into site visits now go into installation work: installers spend that saved 60% of check-in time on new roofs, and support tickets about missing data fell by roughly a third.
Renewable energy software development paid off in a second way the client did not plan for. The public lobby display became a clean energy sales tool: building owners who saw a neighbor's live production asked for their own roof, and the client credits it with around 40 inbound leads in the first year. 24Heures and Der Bund covered the project as a piece of Swiss clean-tech innovation, which did not hurt either.
Want energy software that pays for itself in receivables?
Contact usWhat's Next
The current platform covers monitoring, forecasting, and billing for rooftop solar. Future renewable energy projects on the roadmap add four pieces, and the client wants wind in scope by the second phase:
- Advanced Grid Analytics: Portfolio-level load curves and curtailment history, so the operator can negotiate feed-in terms with data instead of estimates across distributed energy systems on one account.
- Automated Energy Trading: Selling surplus electricity on the day-ahead market through the existing OpenADR link, starting with the ten largest sites.
- Expanded IoT Integration: Heat pumps, EV chargers, and battery storage as first-class devices in the wizard, each with its own tariff logic.
- Enterprise Energy Management: An industrial energy management software tier for factories with multiple meters, sub-metering, and shift-based consumption reporting.
For a related example of connected climate control, explore our smart home app development case study, which automates air conditioners using room conditions and schedules.
Verified Reviews
Our Reputation on Top Platforms
LITSLINK holds a 4.8 rating on Clutch across 70+ reviews and a 4.8 on GoodFirms, and both platforms list us among top SaaS development companies. Clients in the energy sector, including industry experts who have run their own dev teams, point to the same key strengths: engineers who understand device protocols and energy systems, a US-based project manager whose hours overlap, and demos every two weeks that show working software rather than slides. We develop software for digital platforms of any size, from innovative startups to established operators, and keep the process efficient.
Have an Energy Software Project in Mind?
Need to see every site in real time and bill from the same data? Our renewable energy software development team can adapt this platform to your devices, tariffs, and mobile app development needs. We reply within 48 hours.
Next steps:
- LITSLINK specialist reviews your request and contacts you to discuss the details;
- If needed, we can sign an NDA before moving forward;
- We send a project proposal – estimates, timeline, and team CVs included;
- After launch, we stay on for any updates your product needs.
- 48h Response
- 1540+ Projects
Thank you for your message. It has been sent.